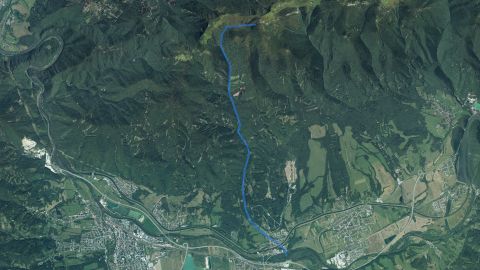
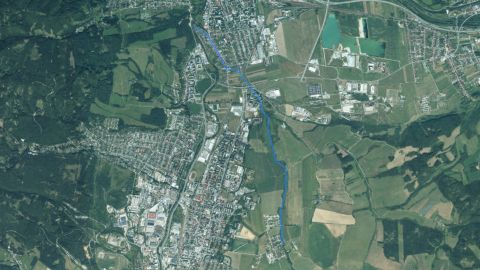
Fishing conditions score, the best window of the day and fishing districts from the best conditions
Average of the watercourse's fishing districts
18from 100
Low activity · average of one fishing district
The number in the header is an estimate for the middle of the watercourse based on weather and measurements. The average of the fishing districts also counts satellite data, shading and geology of each district.
Best window today
15:00–17:00
Derivačný kanál Váhu, window score 30.
The score is an estimate of conditions based on weather, water and surroundings, not a bite forecast. Recalculated at 20:04.
Map and fishing districts of the watercourse
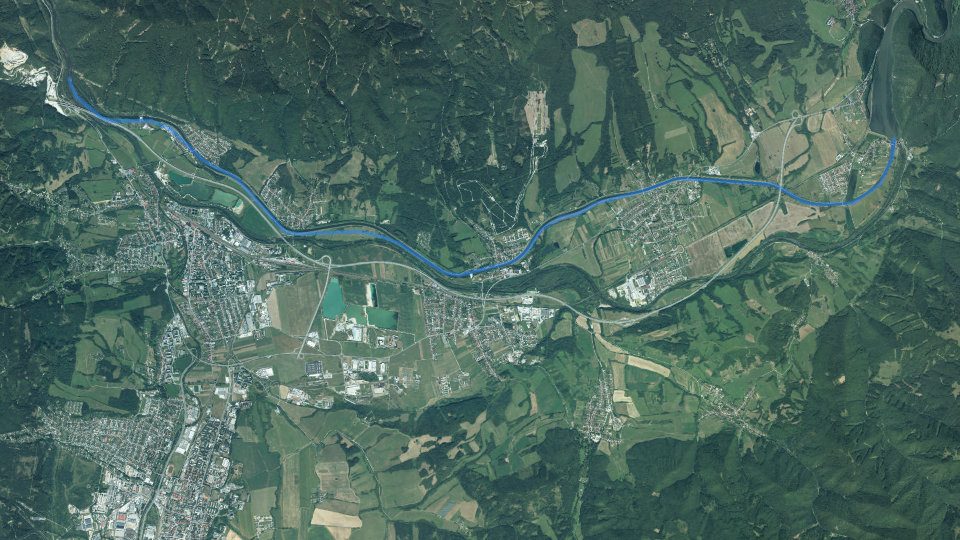
The course of the watercourse and its fishing districts. You can switch the line color to today's conditions, quality or any other parameter.
Detailed filtersregion, district, riverbed, depth, shading, satellites, water chemistry and pollution, fish, geology
1445fishing districts
Pick a category to narrow the selection. Next to each option you can see how many fishing districts remain.
Map color
Loading map…
Move the map with two fingers. In full-screen mode one finger is enough.
CarpSalmonid (trout)Salmonid (grayling)
lowerhigher
The score is an estimate of conditions based on weather, water and surroundings, not a bite forecast. For each fishing district you can see what it is made of, how well it is supported by data and where the data comes from.
Elevation profile: standing water
Terrain height along the fishing district and the approximate water level.
Still waterThis is standing water, so the watercourse is not assessed here: the water has no current, fall or gradient. The chart shows the terrain height along the fishing district.
Terrain elevation profile (Standing water): from 411 to 375 m a.s.l. over 17.3 km.Terrain height along the fishing district line, from the start (left) to the end
Approximate water level
397 m a.s.l.
Lowest point of the profile
375 m a.s.l.
Highest point of the profile
411 m a.s.l.
Source: Open Topo Data (eudem25m), 4 Nov 2026. The height is approximate (error of a few metres).
Terrain in 3D
Loading the 3D terrain model…
Historical images
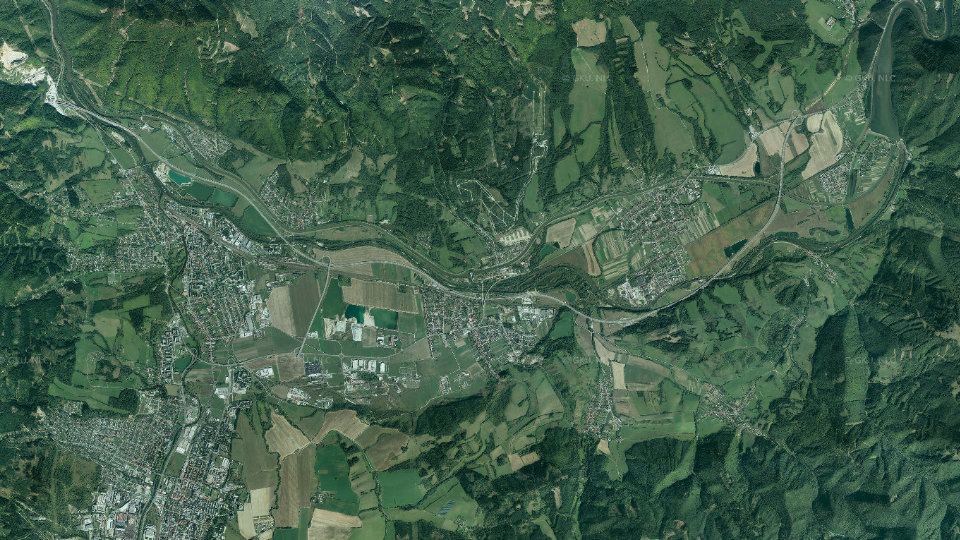
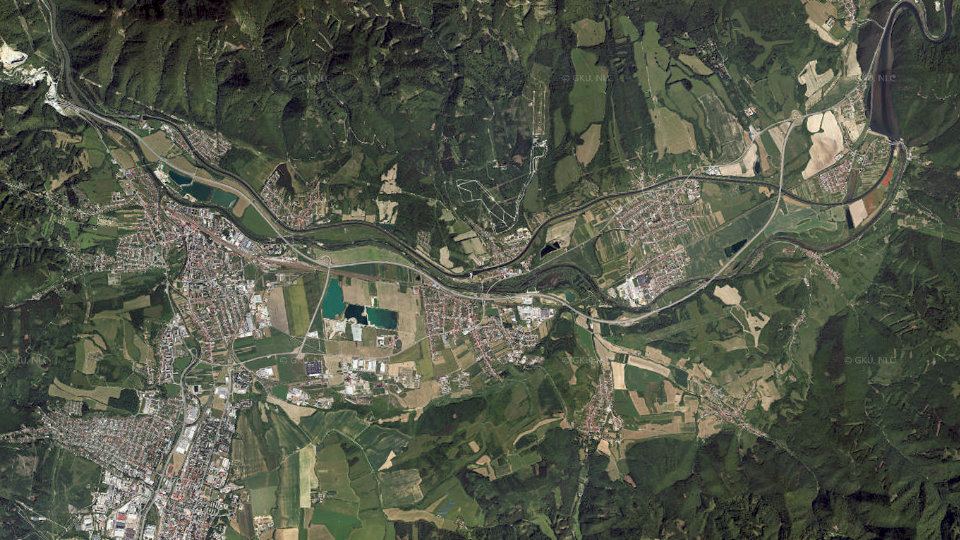
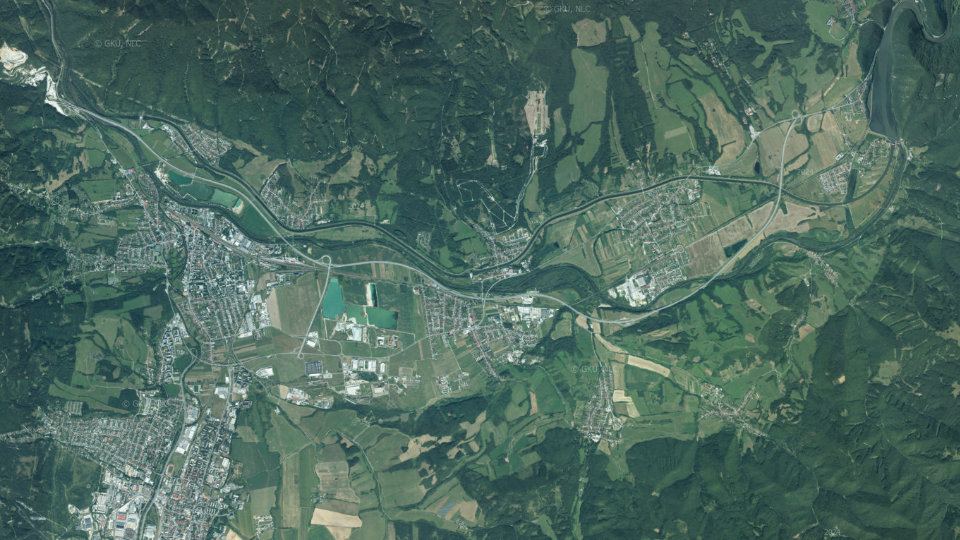
Changes in the surroundings and nature from 2018 to 2024: how the banks, vegetation and landscape around the water change. The images switch automatically; you can also browse them by hand.
2018imaged 10 Sep 20182021imaged 19 Jun 20212024imaged 23 Aug 2024
Source: SHMÚ (yearbooks on surface and groundwater quality), the register of wastewater treatment plants from VÚVH and the EEA. A SHMÚ site is assigned to a fishing district by the same watercourse name and by distance; the yearbook lists the sites that failed the standard, so a missing site is not proof of clean water.
Geology and geochemistry of the Derivačný kanál Váhu stream
Metals and gold in river sediments and water, old mine workings and deposits, boreholes with archive reports, geothermal energy, environmental burdens and landslides around the stream
The overview is based on public registers and atlases of the State Geological Institute of Dionýz Štúr. The search covers a zone around the water of all fishing districts of the stream (17 km of line in total): stream samples within 1 km, boreholes, mine workings and burdens within 3 km, ore occurrences within 5 km, geothermal sources within 10 km.
Rock under the water
River alluvium86% of the water line
14% young sediments
Gravelly and sandy bottom and floodplains; the water is replenished from groundwater in the alluvium. Geological Map of Slovakia 1:50,000.
Water according to the atlas
pH 7.6modelled estimate
water type Ca–Mg–HCO₃
Mineralisation 193 mg/l, soft water (6.5 °dH). Interpolation of measurements from the Geochemical Atlas of Slovakia, not a measurement in the stream.
Elements in river sediment
0 from 15elements in the top 10 %
highest: Selenium 0.517 mg/kg
Position of the highest-ranked element among the sample points on streams in Slovakia: percentile 87. Interpolation of the Geochemical Atlas of river sediments.
up to 50 %
50–75
75–90
90–99
above 99
Heat underfoot
35°C at 1,000 m depth
heat flow 55 mW/m²
At a depth of 2,000 m about 62 °C (increase of 27 °C per kilometre). Atlas of Geothermal Energy of Slovakia.
Natural gamma radiation
49nGy/h dose rate
percentile 41 in Slovakia
Natural background from rocks and soil (potassium, uranium, thorium), not a value measured at the water. Airborne gamma-ray spectrometry by ŠGÚDŠ.
Old mine workings
5objects within 3 km
mined: Fe
Nearest: Odkalisko Dubná Skala (tailings pond), 390 m from the water.
Gold in river sediment
0samples with gold
12 ore minerals in the sediment
No gold was found in river sediment samples within 1 km of the water. The samples do not cover every stream, so this does not mean there is no gold here.
Trace elements in the stream water
1 from 10indicators in the top 5 %
highest: Arsenic 11.7 μg/l
Position of the highest measured value in the distribution of all surface water samples in Slovakia: percentile 96 (Turany, 1150m J od K480).
up to 50 %
50–75
75–90
90–99
above 99
Boreholes and groundwater analyses
412boreholes within 3 km
631 water analyses nearby
Of these, 412 have an archive report from Geofond. The boreholes are hydrogeological, geological, engineering-geological and other.
Geothermal energy
24°C at the wellhead
3 geothermal boreholes within 10 km
Warmest: Stráňavy – HŽK-2, yield 22.0 l/s, 6.1 km from the water.
Environmental burdens and landfills
66sites within 3 km
1 environmental burden, 65 landfills
Nearest burden: Vrútky – rušňové depo, Cargo a.s., 510 m from the water. Proximity does not mean that substances leak from the site into the water.
Deposits and ore occurrences
53records within 5 km
25 deposits, 28 ore occurrences
Geofond registers, the metallogenetic map and the mineral resources map.
Landslides and slope deformations
77areas within 3 km
11 active
Documented landslides in the Geofond register. A landslide into a stream can cloud the water and change the bed.
Geological structure beneath the water
Which rock lies beneath the water line (Geological Map of Slovakia 1:50,000), how old it is, how thick the Quaternary cover is and in which tectonic unit the water flows. The bedrock decides the hardness of the water, the bottom, the turbidity after rain and the abundance of springs.
The points follow the water line (for a stream and a basin, fishing district after fishing district). The strip is a cross-section by distance, not a map; the width of a section corresponds to the number of points.
River alluvium86%SR 72 %
Young sediments14%SR 8.6 %
marker on the bar: share among all sample points on streams in Slovakia
River alluvium: Gravelly and sandy bottom and floodplains; the water is replenished from groundwater in the alluvium.
Geological age of the rocks
Quaternary100%
Most common rock units
System
Age
Unit
Points
Quaternary
Holocene
fluvial sediments: lithofacial undivided alluvial clays, or sandy to gravelly clays of valleys and floodplains
6×
Quaternary
Pleistocene
proluvial sediments: clay and sandy gravel with rock fragments in low alluvial cones
1×
Quaternary cover
Typical thickness of the Quaternary cover6.7m
5 – 1080%SR 20 %
2 – 520%SR 48 %
marker on the bar: share among all sample points on streams in Slovakia
Tectonic division
NEOALPÍNSKE TEKTONICKÉ ŠTRUKTÚRY ZÁPADNÝCH KARPÁT100%SR 84 %
marker on the bar: share among all sample points on streams in Slovakia
Neotectonic units
negative unit (intermountain basins)83%SR 14 %
positive unit (mountain range)17%SR 60 %
marker on the bar: share among all sample points on streams in Slovakia
Direction of neotectonic movements
small subsidence50%SR 8.8 %
medium subsidence33%SR 6.8 %
large uplift17%SR 26 %
marker on the bar: share among all sample points on streams in Slovakia
Regional geological division
intramontane basins83%SR 44 %
core mountains17%SR 11 %
marker on the bar: share among all sample points on streams in Slovakia
Regional geological division (subunits)
inner basins83%SR 4.5 %
Veľká Fatra17%SR 1.5 %
marker on the bar: share among all sample points on streams in Slovakia
Engineering-geological districts
region of lowland-stream deposits83%SR 20 %
region of proluvial cones and mantles17%SR 2.7 %
marker on the bar: share among all sample points on streams in Slovakia
Engineering-geological formations
formation of Quaternary sediments100%SR 71 %
marker on the bar: share among all sample points on streams in Slovakia
Susceptibility of the area to slope deformations
Region of stable areas86%SR 95 %
Region of potentially unstable areas14%SR 4.4 %
marker on the bar: share among all sample points on streams in Slovakia
The map covers 7 of 7 points on the water line.
Hydrogeology: aquifers and groundwater
Streams and rivers are fed by groundwater. Hydrogeological maps show in which rocks the water is stored, how permeable they are and what the water in them is like. The data come from ŠGÚDŠ maps, not from measurements at a particular water.
Aquifer rocks (hydrogeological map 1:200,000)
Gravel80%SR 52 %
Acid plutonic rocks20%SR 3.7 %
marker on the bar: share among all sample points on streams in Slovakia
Aquifer type
Zvodnence s prevažne medzizrnovým typom priepustnosti (prevažne nespevnené sedimenty) (Gravel; Fluviálne)80%SR 27 %
Menšie zvodnence s medzizrnovým alebo puklinovým typom priepustnosti alebo oblasti s takmer žiadnymi množstvami podzemnej vody20%SR 3.7 %
marker on the bar: share among all sample points on streams in Slovakia
Type of permeability (basic hydrogeological map 1:50,000)
intergranular100%SR 86 %
marker on the bar: share among all sample points on streams in Slovakia
Hydrogeological function
aquifer100%SR 95 %
marker on the bar: share among all sample points on streams in Slovakia
Main hydrogeological region
Paleogene, Neogene and the Quaternary of the Turčianska Basin71%SR 1.4 %
Mesozoic and crystalline basement of Kriváň Fatra14%SR 0.0 %
Mesozoic of the northern part of Veľká Fatra14%SR 0.0 %
marker on the bar: share among all sample points on streams in Slovakia
Genetic type of groundwater
silicate-carbonate groundwater100%SR 6.9 %
marker on the bar: share among all sample points on streams in Slovakia
Chemical type of groundwater
Ca-HCO3, or Ca-Mg-HCO3 type80%SR 4.2 %
Ca-Mg-HCO3 typ20%SR 5.5 %
marker on the bar: share among all sample points on streams in Slovakia
Groundwater quality class
A75%SR 36 %
B25%SR 18 %
marker on the bar: share among all sample points on streams in Slovakia
Geothermal groundwater bodies
Turiec Basin100%SR 3.3 %
marker on the bar: share among all sample points on streams in Slovakia
Surface water chemistry according to the atlas
Modelled composition of the water in the area the fishing district line runs through. The rasters of the Geochemical Atlas of Slovakia (surface waters) are an interpolation of measurements in sampled streams, so they show the typical background of the area, not a measurement in a particular stream.
Water acidity
pH 7.62typical range
Most rivers and streams in Slovakia have a pH of 6.5 to 8.5. More acidic water is found in streams on acidic rocks (granites, quartzites), more alkaline water near limestones.
Water hardness
6.5°dH, soft
Sum of calcium and magnesium (1.17 mmol/l). Hard water is buffered and its pH changes more slowly; soft water is more sensitive to acid rain.
soft
medium
hard
very hard
Dissolved substances
193mg/l mineralisation
Total amount of dissolved minerals. Clean mountain water has tens of mg/l, lowland and limestone waters hundreds.
up to 50 %
50–75
75–90
90–99
above 99
Ionic composition of the water
Cations (positive ions)
Ca 66Mg 25
Anions (negative ions)
HCO₃ 72SO₄ 22
Water type by dominant ions: Ca–Mg–HCO₃
Shares are in equivalents, the usual way of comparing the composition of waters.
Major ions
FluoridesF0.130 mg/lpercentile 58
ChloridesCl4.88 mg/lpercentile 33
SulphatesSO425.5 mg/lpercentile 27
MagnesiumMg7.90 mg/lpercentile 23
SodiumNa4.45 mg/lpercentile 23
CalciumCa33.7 mg/lpercentile 22
BicarbonatesHCO3106 mg/lpercentile 20
PotassiumK0.915 mg/lpercentile 9
dot: average along the water line, line: from the lowest to the highest value, scale: position among sample points on streams in Slovakia (0 to 100th percentile)
Nutrients and organic pollution
NitratesNO39.08 mg/lpercentile 69
PhosphatesPO40.0386 mg/lpercentile 22
AmmoniumNH40.0430 mg/lpercentile 21
Chemical oxygen demandChSK1.91 mg/lpercentile 17
Metals
AluminiumAl143 μg/lpercentile 70
IronFe0.123 mg/lpercentile 57
ZincZn6.40 μg/lpercentile 48
ManganeseMn11.4 μg/lpercentile 24
Elements in river sediments
The Geochemical Atlas of Slovakia (river sediments) describes what the river carries in the fine material on its bed. Sediment collects metals from rocks, ore occurrences and past mining and industry. It is not a legal limit or a health risk assessment: it shows how an element on this stream ranks among streams in Slovakia.
Potentially toxic and trace elements
SeleniumSe0.517 mg/kgpercentile 87
CadmiumCd0.405 mg/kgpercentile 81
BismuthBi0.332 mg/kgpercentile 78
MercuryHg0.224 mg/kgpercentile 77
ArsenicAs10.3 mg/kgpercentile 76
AntimonySb1.11 mg/kgpercentile 74
LeadPb20.8 mg/kgpercentile 72
CopperCu30.1 mg/kgpercentile 71
MolybdenumMo0.442 mg/kgpercentile 61
TinSn2.94 mg/kgpercentile 61
ZincZn106 mg/kgpercentile 59
ChromiumCr73.6 mg/kgpercentile 52
CobaltCo8.24 mg/kgpercentile 47
NickelNi23.6 mg/kgpercentile 46
VanadiumV60.8 mg/kgpercentile 31
dot: average along the water line, line: from the lowest to the highest value, scale: position among sample points on streams in Slovakia (0 to 100th percentile)
Major elements (iron, aluminium, calcium, magnesium, potassium, sodium, titanium, manganese, phosphorus)
MagnesiumMg1.49 %percentile 80
CalciumCa4.29 %percentile 76
SodiumNa1.01 %percentile 73
PhosphorusP1,029 mg/kgpercentile 71
AluminiumAl5.72 %percentile 53
PotassiumK1.53 %percentile 52
IronFe2.39 %percentile 32
TitaniumTi3,623 mg/kgpercentile 18
ManganeseMn571 mg/kgpercentile 14
Further elements (barium, strontium, lithium, rubidium, zirconium, yttrium, cerium, boron, beryllium, gallium)
StrontiumSr223 mg/kgpercentile 92
BariumBa576 mg/kgpercentile 83
LithiumLi33.7 mg/kgpercentile 70
CeriumCe63.7 mg/kgpercentile 66
GalliumGa14.0 mg/kgpercentile 50
RubidiumRb85.6 mg/kgpercentile 42
BerylliumBe1.15 mg/kgpercentile 35
BoronB53.2 mg/kgpercentile 30
YttriumY23.5 mg/kgpercentile 28
ZirconiumZr307 mg/kgpercentile 22
Natural radioactivity and radon
Airborne gamma-ray spectrometry by ŠGÚDŠ measures radiation from potassium, uranium and thorium in rocks and soil. Granites and some acidic volcanic rocks have the highest values, limestones and floodplains the lowest. Caesium-137 is a remnant of fallout from the Chernobyl accident and nuclear weapons tests.
Gamma radiation dose rate
49nGy/h in air
range 48 to 58 nGy/h
Natural background from rocks and soil; higher over granites and some acidic volcanic rocks, lower over limestones and floodplains.
up to 50 %
50–75
75–90
90–99
above 99
Radon risk of the bedrock
low
Radon is a natural gas from rocks. The risk concerns buildings and cellars, not the water in the stream; it shows what the bedrock is like.
dot: average along the water line, line: from the lowest to the highest value, scale: position among sample points on streams in Slovakia (0 to 100th percentile)
Areal activity of 137CsCS1371,692 Bq/m²percentile 59
Radon risk by isopleths
low100%SR 36 %
marker on the bar: share among all sample points on streams in Slovakia
Geophysical fields: magnetics and gravity
Maps of the magnetic field and gravity (ŠGÚDŠ) reveal what lies beneath the sediments and the surface: volcanic bodies, faults and crustal thickness. For an angler they are interesting indirectly: they show where the bedrock changes, and with it the water.
Magnetic anomaly
+21nT
range 13 to 44 nT
Deviation of the Earth's magnetic field from its surroundings. Positive and negative anomalies reveal rocks with magnetite (basalts, basic volcanic rocks) and boundaries in the bedrock.
negativepositive
Bouguer gravity anomaly
-51mGal
residual −8.2 mGal
Negative values lie over thick sediments and under mountains (light crust), positive over dense rocks and thinner crust. It shows the structure of the Earth's crust, not the water.
Geothermal potential
The Atlas of Geothermal Energy of Slovakia records rock temperature and heat flow from the Earth's interior. It is the potential of the area, not the actual warmth of the water in the stream. Specific geothermal boreholes and springs near this water are in the geothermal energy section below.
Rock temperature with depth
35 / 62 °Cat depths of 1,000 and 2,000 m
increase of 27 °C per km
The line shows the rock temperature; the dotted part is only an extension to the surface. Heat flow 55 mW/m².
Geothermal groundwater bodies beneath the water line
Turiec Basin100%SR 3.3 %
marker on the bar: share among all sample points on streams in Slovakia
Relief, climate and soils
A basin is not just water: slope and elevation determine the speed of runoff, climate the temperature and amount of water, and soils what is washed into the stream. The data come from the geomorphological division, climatic-geographical types and soil maps of ŠGÚDŠ.
Elevation of geomorphological units (from–to)52–1 475m a.s.l.
Average elevation of the units473m a.s.l.
Average slope4.2°
Average January temperature-4.3°C
Average July temperature17.1°C
Annual precipitation713mm
Geomorphological units
Turiec Basin86%SR 1.7 %
Malá Fatra14%SR 0.0 %
marker on the bar: share among all sample points on streams in Slovakia
Geomorphological regions
Fatra–Tatra area100%SR 21 %
marker on the bar: share among all sample points on streams in Slovakia
Climatic-geographical types
basin climate100%SR 29 %
marker on the bar: share among all sample points on streams in Slovakia
Susceptibility of soils to acidification
naturally acidic soils50%SR 8.5 %
soils not susceptible to acidification50%SR 27 %
marker on the bar: share among all sample points on streams in Slovakia
Soil contamination (map 1:500,000)
uncontaminated soil, the geogenically determined content of some risk elements reaches limit values A57%SR 45 %
relatively clean soil43%SR 53 %
marker on the bar: share among all sample points on streams in Slovakia
Lithogeochemical types
Inner Carpathian Paleogene75%SR 11 %
Neogene25%SR 48 %
marker on the bar: share among all sample points on streams in Slovakia
Map of the corridor
Where the nearest mine workings, deposits, burdens, geothermal boreholes and gold finds are. Groups can be switched off.
The line is the water of the fishing district, the light band is the 3 km zone in which boreholes, mine workings and burdens were searched for. The map shows the nearest objects (at most a few dozen from each register), not all of them. The points correspond to the position in the register; area objects are marked by their centre.
Trace elements in surface waters
Arsenic, antimony, cadmium, lead, copper, zinc and other elements in samples from rivers and streams (Geochemical Atlas of Slovakia, surface waters, 2015). The bar shows where the highest value lies among all samples in Slovakia; the light marker is the median of the samples at this water.
ArsenicAshigh (top 5 %)
highest 11.7 μg/lmedian 1.70 μg/l12 samples25 % below the limit of quantification
up to 50 %
50–75
75–90
90–99
above 99
Highest value: Turany, 1150m J od K4801993, 460 m from the water. Comparison: percentile 96 of all samples in Slovakia.
BariumBaelevated (top 10 %)
highest 110 μg/lmedian 70.0 μg/l12 samples
up to 50 %
50–75
75–90
90–99
above 99
Highest value: Lipovec, 800m JV od K6841993, 380 m from the water. Comparison: percentile 92 of all samples in Slovakia.
AntimonySbslightly elevated
highest 1.20 μg/lmedian 0.500 μg/l11 samples91 % below the limit of quantification
up to 50 %
50–75
75–90
90–99
above 99
Highest value: Váh1993, 190 m from the water. Comparison: percentile 85 of all samples in Slovakia.
CopperCuslightly elevated
highest 3.50 μg/lmedian 1.00 μg/l12 samples67 % below the limit of quantification
up to 50 %
50–75
75–90
90–99
above 99
Highest value: Váh1993, 190 m from the water. Comparison: percentile 83 of all samples in Slovakia.
StrontiumSrslightly elevated
highest 370 μg/lmedian 80.0 μg/l11 samples
up to 50 %
50–75
75–90
90–99
above 99
Highest value: Turany, 450m JZ od K4801993, 330 m from the water. Comparison: percentile 80 of all samples in Slovakia.
LithiumLislightly elevated
highest 11.0 μg/lmedian 5.00 μg/l12 samples92 % below the limit of quantification
up to 50 %
50–75
75–90
90–99
above 99
Highest value: Turany, 450m JZ od K4801993, 330 m from the water. Comparison: percentile 76 of all samples in Slovakia.
CadmiumCdslightly elevated
highest 0.250 μg/lmedian 0.250 μg/l12 samples8 % below the limit of quantification
up to 50 %
50–75
75–90
90–99
above 99
Highest value: Váh, 190 m from the water. Comparison: percentile 75 of all samples in Slovakia.
SeleniumSebelow half of Slovakia
highest 0.500 μg/lmedian 0.500 μg/l12 samples100 % below the limit of quantification
up to 50 %
50–75
75–90
90–99
above 99
Highest value: Váh1993, 190 m from the water. Comparison: percentile 46 of all samples in Slovakia.
LeadPbbelow half of Slovakia
highest 2.50 μg/lmedian 2.50 μg/l12 samples100 % below the limit of quantification
up to 50 %
50–75
75–90
90–99
above 99
Highest value: Váh1993, 190 m from the water. Comparison: percentile 43 of all samples in Slovakia.
ChromiumCrbelow half of Slovakia
highest 1.00 μg/lmedian 1.00 μg/l12 samples100 % below the limit of quantification
up to 50 %
50–75
75–90
90–99
above 99
Highest value: Váh1993, 190 m from the water. Comparison: percentile 32 of all samples in Slovakia.
Major ions, mineralisation and pH
Basic water chemistry: which rocks the minerals in it come from.
Silicon dioxideSiO2slightly elevated
highest 22.7 mg/lmedian 11.5 mg/l12 samples
up to 50 %
50–75
75–90
90–99
above 99
Highest value: Kubalov, potok1993, 340 m from the water. Comparison: percentile 80 of all samples in Slovakia.
Gold and ore minerals in river sediments
Regional panning prospecting: the heavy fraction was washed out of river gravel and the mineral grains in it were counted. The map of finds is positive: a sample without gold is not listed in the atlas, so the absence of a find is not proof that there is no gold.
Magnetite (Fe₃O₄)17 samples, at most 55 grains
Pyrite (FeS₂)16 samples, at most 55 grains
Barite (BaSO₄)15 samples, at most 315 grains
Ilmenit (FeTiO₃)10 samples, at most 1815 grains
Monazit ((Ce,La,Nd)PO₄)9 samples, at most 55 grains
Rutil (TiO₂)9 samples, at most 315 grains
Limonite (FeO(OH)·nH₂O)8 samples, at most 815 grains
Anatas (TiO₂)7 samples, at most 55 grains
Hematite (Fe₂O₃)5 samples, at most 55 grains
Scheelit (CaWO₄)4 samples, at most 5 grains
Arsenopyrite (FeAsS)2 samples, at most 5 grains
Kasiterit (SnO₂)1 sample, at most 1 grains
Rock-forming and accessory minerals
Granáty ((Fe,Mg,Ca,Mn)₃Al₂Si₃O₁₂)18 samples, at most 1815 grains
Zirconium (ZrSiO₄)16 samples, at most 315 grains
Tourmalines (complex borosilicate)13 samples, at most 55 grains
Apatit (Ca₅(PO₄)₃(F,Cl,OH))8 samples, at most 315 grains
Epidot (Ca₂(Al,Fe)₃Si₃O₁₂(OH))7 samples, at most 55 grains
Pyroxény ((Mg,Fe,Ca)₂Si₂O₆)6 samples, at most 5 grains
Amfiboly (Ca₂(Mg,Fe)₅Si₈O₂₂(OH)₂)6 samples, at most 55 grains
Korund (Al₂O₃)4 samples, at most 5 grains
Kyanit (Al₂SiO₅)2 samples, at most 5 grains
Sillimanit (Al₂SiO₅)2 samples, at most 5 grains
Spinel (Cr-spinel) ((Mg,Fe)(Al,Cr)₂O₄)1 sample, at most 5 grains
Staurolit (Fe₂Al₉Si₄O₂₃(OH))1 sample, at most 5 grains
Groundwater: chemistry, water types and radioactivity
Hydrogeochemical objects (analyses of springs and boreholes), the geochemical atlas of groundwater (1996) and radiohydrochemical sampling. Groundwater feeds streams, so its composition also affects the water in the stream.
Chemical water types nearby
Ca-HCO376×
Ca-Mg-HCO37×
Ca-(Mg)-HCO32×
Ca-NO3-HCO31×
Ca-Cl-SO41×
Ca-Cl-HCO31×
Ca-SO4-HCO31×
Ca-HCO3-SO41×
Water quality class according to the hydrogeochemical map
class A27×
class H15×
class G14×
class C10×
class B10×
class D10×
class E3×
class F2×
Metals in groundwater
CopperCuextreme (top 1 %)
highest 29.5 μg/lmedian 0.425 μg/l42 samples
up to 50 %
50–75
75–90
90–99
above 99
Highest value: vrt1992, 1.4 km from the water. Comparison: percentile 99 of all samples in Slovakia.
LeadPbextreme (top 1 %)
highest 18.0 μg/lmedian 0.500 μg/l42 samples57 % below the limit of quantification
up to 50 %
50–75
75–90
90–99
above 99
Highest value: vrt1992, 1.1 km from the water. Comparison: percentile 99 of all samples in Slovakia.
AluminiumAlextreme (top 1 %)
highest 0.630 mg/lmedian 0.00500 mg/l42 samples69 % below the limit of quantification
up to 50 %
50–75
75–90
90–99
above 99
Highest value: prameň1992, 1.5 km from the water. Comparison: percentile 99 of all samples in Slovakia.
MercuryHgextreme (top 1 %)
highest 1.10 μg/lmedian 0.100 μg/l42 samples79 % below the limit of quantification
up to 50 %
50–75
75–90
90–99
above 99
Highest value: prameň1992, 1.5 km from the water. Comparison: percentile 99 of all samples in Slovakia.
ArsenicAsextreme (top 1 %)
highest 18.0 μg/lmedian 1.20 μg/l42 samples48 % below the limit of quantification
up to 50 %
50–75
75–90
90–99
above 99
Highest value: studňa1992, 810 m from the water. Comparison: percentile 99 of all samples in Slovakia.
LithiumLihigh (top 5 %)
highest 75.0 μg/lmedian 4.00 μg/l42 samples26 % below the limit of quantification
up to 50 %
50–75
75–90
90–99
above 99
Highest value: vrt1992, 2.9 km from the water. Comparison: percentile 96 of all samples in Slovakia.
SeleniumSehigh (top 5 %)
highest 2.80 μg/lmedian 0.500 μg/l42 samples76 % below the limit of quantification
up to 50 %
50–75
75–90
90–99
above 99
Highest value: prameň1992, 1.4 km from the water. Comparison: percentile 95 of all samples in Slovakia.
AntimonySbhigh (top 5 %)
highest 0.900 μg/lmedian 0.100 μg/l42 samples76 % below the limit of quantification
up to 50 %
50–75
75–90
90–99
above 99
Highest value: vrt1992, 1.4 km from the water. Comparison: percentile 95 of all samples in Slovakia.
ZincZnelevated (top 10 %)
highest 624 μg/lmedian 8.50 μg/l42 samples14 % below the limit of quantification
up to 50 %
50–75
75–90
90–99
above 99
Highest value: studňa1992, 810 m from the water. Comparison: percentile 91 of all samples in Slovakia.
ChromiumCrslightly elevated
highest 1.60 μg/lmedian 0.250 μg/l42 samples79 % below the limit of quantification
up to 50 %
50–75
75–90
90–99
above 99
Highest value: prameň1992, 1.5 km from the water. Comparison: percentile 85 of all samples in Slovakia.
IronFetypical value
highest 0.00500 mg/lmedian 0.00500 mg/l30 samples100 % below the limit of quantification
up to 50 %
50–75
75–90
90–99
above 99
Highest value: prameň1992, 2.9 km from the water. Comparison: percentile 50 of all samples in Slovakia.
CadmiumCdbelow half of Slovakia
highest 0.250 μg/lmedian 0.250 μg/l42 samples100 % below the limit of quantification
up to 50 %
50–75
75–90
90–99
above 99
Highest value: prameň1992, 2.9 km from the water. Comparison: percentile 47 of all samples in Slovakia.
Radon in waters
Type of site
Samples
Highest radon
Median
source
11
32,8 Bq/l
2.71 Bq/l
developed spring
1
24,5 Bq/l
24.5 Bq/l
free-flowing borehole
1
11,1 Bq/l
11.1 Bq/l
water source for individual supply
1
24,3 Bq/l
24.3 Bq/l
Mine workings, deposits and ore occurrences
Old mine workings outside mining areas (Geofond register), deposits and mining areas, and the metallogenetic map. Gold, silver and other metals near streams can get into sediments and water.
What was mined here (according to the register of old mine workings)
Fe3×
Types of mining objects
other type of object3×
tailings pond2×
Nearest old mine workings
Name
Type
Mined
Ended
From the water
Odkalisko Dubná Skala
tailings pond
building stone
390 m
Odkalisko Lipovec
tailings pond
gravelly sands
660 m
Výhradná kutba
other type of object
probably Fe
2.1 km
Výhradná kutba
other type of object
Fe ores
1945
2.4 km
Výhradná kutba
other type of object
Fe ores
1945
2.6 km
Deposits and mining areas
Deposit
Mineral
Status and organisation
From the water
Turany – Záblatie
gravelly sands and sands
Deposit with halted mining or where use of reserves is not expected – VÁHOSTAV, a.s.
330 m
Sučany I
gravelly sands and sands
Deposit with halted mining or where use of reserves is not expected – VÁHOSTAV, a.s.
350 m
Vrútky – Lipovec
gravelly sands and sands
Mined deposit – BRA-VUR, a.s.
440 m
Vrútky – Lipovec
gravelly sands and sands
Mined deposit – BRA-VUR, a.s.
440 m
Vrútky – Lipovec
gravelly sands and sands
Mined deposit – BRA-VUR, a.s.
520 m
Vrútky – Dubná Skala
building stone
Mined deposit – EUROVIA – Kameňolomy, s.r.o.
710 m
Vrútky – Dubná Skala
building stone
Mined deposit – EUROVIA – Kameňolomy, s.r.o.
870 m
Vrútky – Dubná Skala
building stone
Mined deposit – EUROVIA – Kameňolomy, s.r.o.
1.1 km
Sučany II
gravelly sands and sands
Deposit with halted mining or where use of reserves is not expected – VÁHOSTAV, a.s.
1.1 km
Sučany III
gravelly sands and sands
Deposit with halted mining or where use of reserves is not expected – VÁHOSTAV, a.s.
1.1 km
Sučany
gravelly sands and sands
Deposit with halted mining or where use of reserves is not expected – PREFA invest, a.s.
1.4 km
Sučany
gravelly sands and sands
Deposit with halted mining or where use of reserves is not expected – PREFA invest, a.s.
1.4 km
Ore occurrences in the metallogenic map
Occurrence
Ore type
Metals
Type
From the water
Strečno I-II
Copper ores
Cu
mineralogical occurrence
3.3 km
Boreholes and Geofond archive reports
Register of hydrogeological boreholes, other boreholes and geothermal boreholes. Each borehole has a report in the Geofond archive (geological profiles, pumping tests, chemical analyses of the water); the report number is in the table.
412 boreholes in the 3 km zone, of which 116 hydrogeological and 296 other; with an archive report number 412.
Borehole depths
up to 10 m130×
10–30 m255×
30–100 m10×
100–300 m4×
over 300 m0×
Nearest boreholes
Site
Type
Depth
Archive report
From the water
Turany Krpelany
monitoring borehole
10.0 m
77718 99Ca31.pdf
20 m
Turany Krpelany
monitoring borehole
11.0 m
77718 99Ca32.pdf
30 m
Lipovec
monitoring borehole
15.0 m
93355 98Db83.pdf
50 m
Sučany
monitoring borehole
15.0 m
93354 99Ca42.pdf
50 m
Lipovec
monitoring borehole
15.0 m
93355 98Db84.pdf
50 m
Sučany
monitoring borehole
10.0 m
93354 99Ca44.pdf
50 m
Sučany
monitoring borehole
15.0 m
93354 99Ca43.pdf
50 m
Turany Krpelany
monitoring borehole
11.0 m
77718 99Ca27.pdf
50 m
J-1
engineering-geological
8.0 m
84870
50 m
Lipovec
monitoring borehole
10.0 m
93355 98Db85.pdf
60 m
Sučany
monitoring borehole
10.0 m
93354 99Ca41.pdf
60 m
Sučany
monitoring borehole
15.0 m
93354 99Ca40.pdf
60 m
Geothermal energy and mineral waters
Geothermal boreholes (wellhead water temperature, yield, chemical type) and sources of geothermal and mineral waters within 10 km. Data on the use and existence of a borehole come from the Geofond register.
Borehole
Temperature
Yield
Depth
Chemical water type
Use
From the water
Stankovany – STH-1A
18 °C
0.7 l/s
67 m
Ca-Mg-HCO3-SO4
unused
5.0 km
Stráňavy – HŽK-2
24 °C
22.0 l/s
600 m
Ca-Mg-HCO3-SO4
in use without data reporting
6.1 km
Martin – ZGT-3
–
–
2461 m
–
unused
8.8 km
Sources of geothermal and mineral waters
Source
Type
Water temperature (°C)
Yield (l/s)
Count
Nearest from water
category a1
mineral water
< 15
< 5
12
3.4 km
category b1
mineral water
15-22
< 5
2
5.2 km
category b4
mineral water
15-22
31-50
1
5.4 km
category Stráňavy
thermal baths
–
–
1
6.6 km
Environmental burdens, landfills and anthropogenic sediments
Recorded environmental burdens (industrial sites, landfills, mining), the register of waste landfills and monitoring of anthropogenic sediments (industrial sludge). It is a list of places, not a measurement of water pollution.
Environmental burdens
Site
Activity
Substance
Classification
From the water
Vrútky – rušňové depo, Cargo a.s.
SK1000500P
510 m
Waste landfills
Landfill
Area
Year established
Monitoring
From the water
pod kanálom – bridge – Lipovec
60 m²
–
–
100 m
výjazd na Turčianske Kľačany – Lipovec
400 m²
–
–
100 m
pod VD – Krpeľany
100 m²
–
–
200 m
pri ceste Ont. – Turčianske Kľačany
–
–
–
210 m
pri vod. Ramene – Turany
210 m²
–
–
240 m
pri kan. z VE – Turany
2 500 m²
–
–
240 m
za cestou, Dub. Skala – Vrútky
–
–
–
250 m
za zákrutou cesty – Turčianske Kľačany
20 m²
–
–
270 m
Landslides and slope deformations
Register of documented slope deformations (Geofond). Landslides by a stream can bring fine material into the water, change the bed and dam the channel.
Types of deformations
Landslides72×
Slope flows2×
Block fissures2×
Block fields1×
Degree of activity
Potenciálny59×
Aktívny10×
Stabilizovaný6×
With stabilised and potential forms1×
With potential and active forms1×
Current state
SD taken from archival materials, ktorá bola konfrontova50×
Processed only in the scope of registration on a scale of 1:25,00021×
SD prebraná z archívnych materiálov (existuje inž. geologick1×
SD zaregistrovaná v rámci terénneho výskumu na úlohe Atlas S1×
How to read these data
Zone and distance. The distance is measured from the line of the water to the point in the register (to the centre for areas), with an accuracy of tens of metres. Counts apply only to the zone, not to the whole catchment.
Percentile. For chemistry, the highest value is compared with all atlas samples in Slovakia. It is not a legal limit or a health risk assessment; the atlases are historical (published: surface waters 2015, groundwater 1996, river sediments 1999).
Limit of quantification. Many samples have a value at the lowest level the laboratory can determine; such results mean "below the limit". For these, the position in the distribution is an estimate.
Panning concentrates. Only samples with a find are recorded. The number of grains in a concentrate is not the gold content in grams per tonne.
Relation to water. A mine working, landfill or burden nearby proves nothing about the quality of the water in the stream. It serves as a prompt for attention and a starting point for further investigation.
Sample points. The area and raster maps of ŠGÚDŠ cannot be downloaded as points, so along the line of each fishing district the value is looked up at points roughly every 3 km. It is a sample of the line, not a continuous record; a very short section may have a single point.
Atlas rasters. The chemistry of water and sediments is an interpolation of measurements in a sampling network (Geochemical Atlas of Slovakia). The value at a point is a modelled estimate for the surroundings, not a measurement in the water. The percentile compares the average of this stream with all sample points on streams in Slovakia.
Positions and scales. The maps have different scales (1:50,000 to 1:1,000,000), so the level of detail differs between sections. A map outside its coverage means there is no area at that point, not that there is nothing there.