Fishing conditions score, the best window of the day and fishing districts from the best conditions
Average of the watercourse's fishing districts
15from 100
Low activity · average of 3 fishing districts
The number in the header is an estimate for the middle of the watercourse based on weather and measurements. The average of the fishing districts also counts satellite data, shading and geology of each district.
Very high0
High0
Average0
Low3
When the best window ishow many fishing districts have their best two-hour window in a given hour
00
06
12
18
Most fishing districts have their best window around 06:00.
The score is an estimate of conditions based on weather, water and surroundings, not a bite forecast. Recalculated at 07:04.
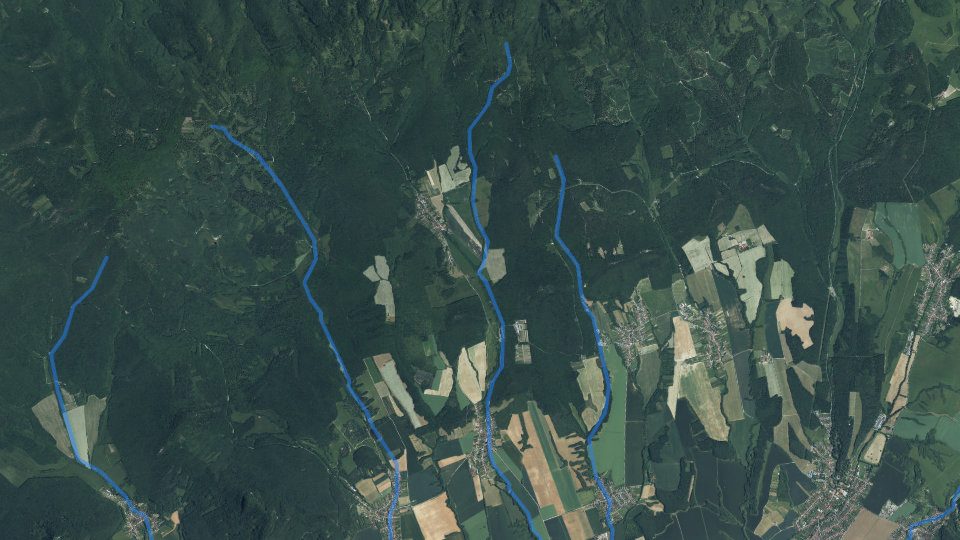
Map and fishing districts of the watercourse
The course of the watercourse and its fishing districts. You can switch the line color to today's conditions, quality or any other parameter.
Detailed filtersregion, district, riverbed, depth, shading, satellites, water chemistry and pollution, fish, geology
1445fishing districts
Pick a category to narrow the selection. Next to each option you can see how many fishing districts remain.
Map color
Loading map…
Move the map with two fingers. In full-screen mode one finger is enough.
CarpSalmon – troutSalmon – grayling
lowerhigher
The score is an estimate of conditions based on weather, water and surroundings, not a bite forecast. For each fishing district you can see what it is made of, how well it is supported by data and where the data comes from.
Water state on the watercourse
Measurement of water level, temperature and flow, weather by the watercourse and status from satellites
Water levels on the watercourse
Stanica
Stav
Zmena
Teplota
Obyce
14 cm
–
Vieska nad Žitavou
128 cm
–
Vlkas
10 cm
–
Elevation profile of the watercourse
How the watercourse falls downstream: fall, gradient and water speed.
Slow watercourseA lowland river with a calm current, shallows along the banks and deeper pools in the bends.
Elevation profile of the watercourse: from 241 to 115 m a.s.l. over 71.0 km.Fishing districts in order from the highest (left) to the lowest. There may be a section without a fishing district between districts; it is not displayed.
Highest point
241 m a.s.l.
Lowest point
114 m a.s.l.
Fall of the fishing districtsFallThe difference in altitude between the upper and lower end of the fishing district in metres. The greater the fall over a shorter length, the faster the water.
127 m
Average gradientWatercourse gradientFall per kilometre in per mille (‰, metres per kilometre). Up to 2 ‰ is a slow lowland river, 5 to 10 ‰ a foothill river (grayling, trout), above 10 ‰ a fast stream.
1,8 ‰
SinuositySinuosityThe length of the watercourse divided by the straight-line distance between its ends. 1.0 is a straight watercourse; above 1.3 it meanders strongly. Meanders create pools under the banks and shallows in the reaches between.
1,20
Source: Open Topo Data (eudem25m), 4 Nov 2026. Gradient and fall are approximate and include only the sections of fishing districts.
Terén v 3D
Loading the 3D terrain model…
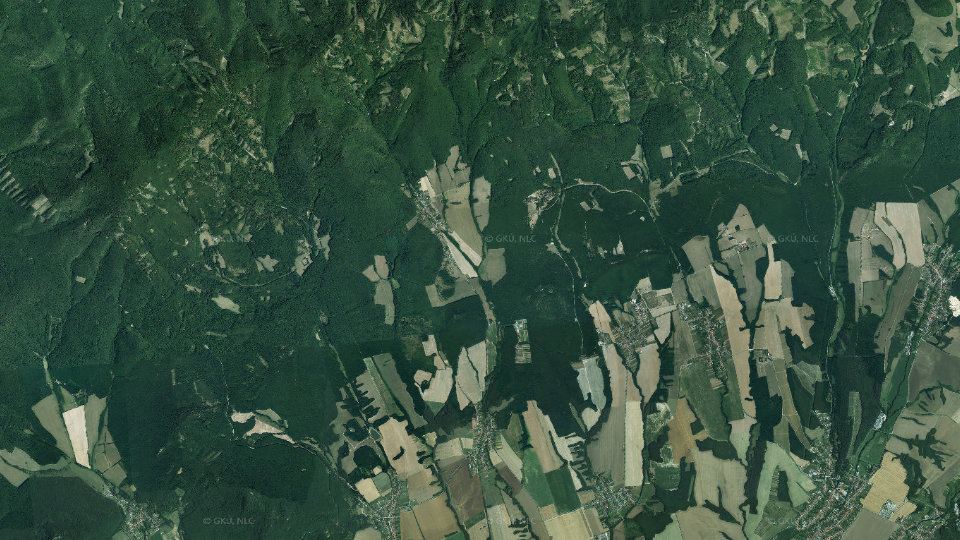
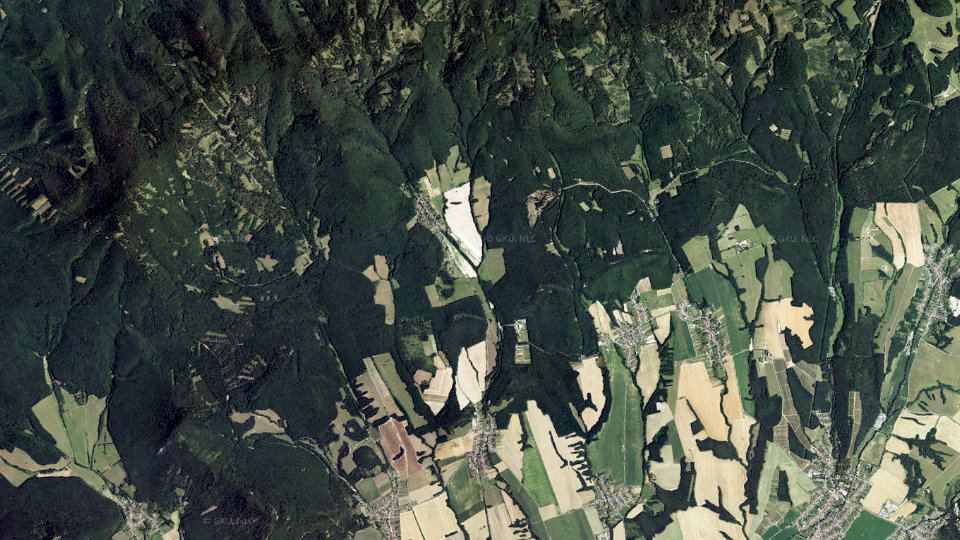
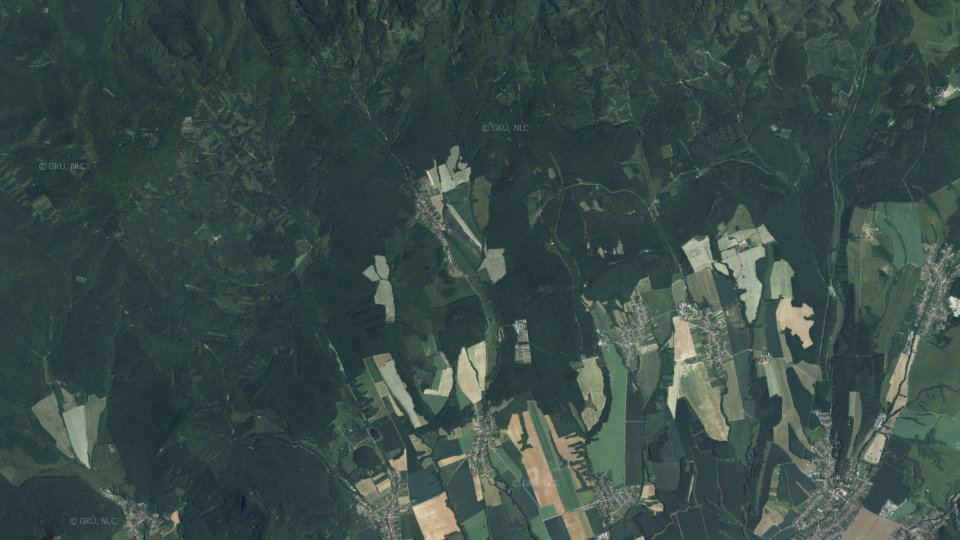
Historical images
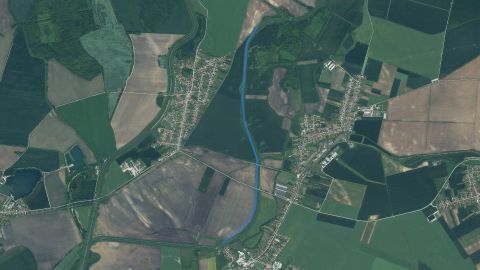
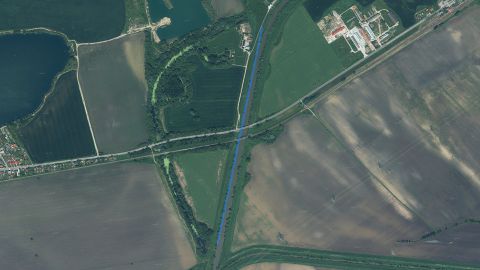
Changes in the surroundings and nature from 2017 to 2023: how the banks, vegetation and landscape around the water change. The images switch automatically; you can also browse them by hand.
2017imaged 16 Aug 20172020imaged 2 Aug 20202023imaged 1 Jun 2023
Source: SHMÚ (yearbooks on surface and groundwater quality), the register of wastewater treatment plants from VÚVH and the EEA. A SHMÚ site is assigned to a fishing district by the same watercourse name and by distance; the yearbook lists the sites that failed the standard, so a missing site is not proof of clean water.
Organizations and location
Who manages the fishing districts and where they are
Organizations on the watercoursewho manages the fishing districts and what the conditions are there today