Fishing conditions score, the best window of the day and fishing districts from the best conditions Low activity · average of 2 fishing districts 15:00–17:00 Ižianský kanál č. 1, window score 18. The score is an estimate of conditions based on weather, water and surroundings, not a bite forecast. Recalculated at 04:04. The course of the watercourse and its fishing districts. You can switch the line color to today's conditions, quality or any other parameter. Detailed filtersregion, district, riverbed, depth, shading, satellites, water chemistry and pollution, fish, geology Move the map with two fingers. In full-screen mode one finger is enough. The score is an estimate of conditions based on weather, water and surroundings, not a bite forecast. For each fishing district you can see what it is made of, how well it is supported by data and where the data comes from. Terrain height along the fishing district and the approximate water level. Still water This is standing water, so the watercourse is not assessed here: the water has no current, fall or gradient. The chart shows the terrain height along the fishing district. Source: Open Topo Data (eudem25m), 4 Nov 2026. The height is approximate (error of a few metres). Loading the 3D terrain model… Changes in the surroundings and nature from 2017 to 2023: how the banks, vegetation and landscape around the water change. The images switch automatically; you can also browse them by hand. Orthophoto mosaic of Slovakia © GKÚ Bratislava, NLC Zvolen. The year and day of imaging depend on the location, so individual years may differ in season and weather. Water quality according to SHMÚ, wastewater treatment plants near the fishing districts and groundwater nearby 2 of 2 of the watercourse's fishing districts with SHMÚ data have an unmet standard at the nearest site in at least one indicator. 2 of 2 fishing districts with measurements have groundwater nearby with a value above the limit for at least one indicator. Water pollution in the Danube basinPolluted water in Slovakia Source: SHMÚ (yearbooks on surface and groundwater quality), the register of wastewater treatment plants from VÚVH and the EEA. A SHMÚ site is assigned to a fishing district by the same watercourse name and by distance; the yearbook lists the sites that failed the standard, so a missing site is not proof of clean water. Metals and gold in river sediments and water, old mine workings and deposits, boreholes with archive reports, geothermal energy, environmental burdens and landslides around the stream The overview is based on public registers and atlases of the State Geological Institute of Dionýz Štúr. The search covers a zone around the water of all fishing districts of the stream (14 km of line in total): stream samples within 1 km, boreholes, mine workings and burdens within 3 km, ore occurrences within 5 km, geothermal sources within 10 km. River alluvium67% of the water line 33% other rocks Gravelly and sandy bottom and floodplains; the water is replenished from groundwater in the alluvium. Geological Map of Slovakia 1:50,000. pH 7.8modelled estimate water type Ca–Mg–SO₄–HCO₃ Mineralisation 1,470 mg/l, very hard water (44.1 °dH). Interpolation of measurements from the Geochemical Atlas of Slovakia, not a measurement in the stream. 0 from 15elements in the top 10 % highest: Chromium 71.8 mg/kg Position of the highest-ranked element among the sample points on streams in Slovakia: percentile 50. Interpolation of the Geochemical Atlas of river sediments. 48°C at 1,000 m depth heat flow 65 mW/m² At a depth of 2,000 m about 75 °C (increase of 27 °C per kilometre). Atlas of Geothermal Energy of Slovakia. 49nGy/h dose rate percentile 42 in Slovakia Natural background from rocks and soil (potassium, uranium, thorium), not a value measured at the water. Airborne gamma-ray spectrometry by ŠGÚDŠ. 0objects within 3 km No old mine working is recorded within 3 km of the water. 0samples with gold No gold was found in river sediment samples within 1 km of the water. The samples do not cover every stream, so this does not mean there is no gold here. 1 from 9indicators in the top 5 % highest: Strontium 3,200 μg/l Position of the highest measured value in the distribution of all surface water samples in Slovakia: percentile 99 (VAH). 402boreholes within 3 km 270 water analyses nearby Of these, 401 have an archive report from Geofond. The boreholes are hydrogeological, geological, engineering-geological and other. 64°C at the wellhead 15 geothermal boreholes within 10 km Warmest: Komárno – Nová Stráž – FGK-1, yield 3.3 l/s, 5.9 km from the water. 10sites within 3 km 5 environmental burdens, 5 landfills Nearest burden: Komárno – Harčáš, 410 m from the water. Proximity does not mean that substances leak from the site into the water. 9records within 5 km 9 ore occurrences Geofond registers, the metallogenetic map and the mineral resources map. 0areas within 3 km Documented landslides in the Geofond register. A landslide into a stream can cloud the water and change the bed. Which rock lies beneath the water line (Geological Map of Slovakia 1:50,000), how old it is, how thick the Quaternary cover is and in which tectonic unit the water flows. The bedrock decides the hardness of the water, the bottom, the turbidity after rain and the abundance of springs. The points follow the water line (for a stream and a basin, fishing district after fishing district). The strip is a cross-section by distance, not a map; the width of a section corresponds to the number of points. marker on the bar: share among all sample points on streams in Slovakia River alluvium: Gravelly and sandy bottom and floodplains; the water is replenished from groundwater in the alluvium. marker on the bar: share among all sample points on streams in Slovakia marker on the bar: share among all sample points on streams in Slovakia marker on the bar: share among all sample points on streams in Slovakia marker on the bar: share among all sample points on streams in Slovakia marker on the bar: share among all sample points on streams in Slovakia marker on the bar: share among all sample points on streams in Slovakia marker on the bar: share among all sample points on streams in Slovakia marker on the bar: share among all sample points on streams in Slovakia marker on the bar: share among all sample points on streams in Slovakia marker on the bar: share among all sample points on streams in Slovakia The map covers 3 of 7 points on the water line. Streams and rivers are fed by groundwater. Hydrogeological maps show in which rocks the water is stored, how permeable they are and what the water in them is like. The data come from ŠGÚDŠ maps, not from measurements at a particular water. marker on the bar: share among all sample points on streams in Slovakia marker on the bar: share among all sample points on streams in Slovakia marker on the bar: share among all sample points on streams in Slovakia marker on the bar: share among all sample points on streams in Slovakia marker on the bar: share among all sample points on streams in Slovakia marker on the bar: share among all sample points on streams in Slovakia marker on the bar: share among all sample points on streams in Slovakia marker on the bar: share among all sample points on streams in Slovakia marker on the bar: share among all sample points on streams in Slovakia Modelled composition of the water in the area the fishing district line runs through. The rasters of the Geochemical Atlas of Slovakia (surface waters) are an interpolation of measurements in sampled streams, so they show the typical background of the area, not a measurement in a particular stream. pH 7.80typical range Most rivers and streams in Slovakia have a pH of 6.5 to 8.5. More acidic water is found in streams on acidic rocks (granites, quartzites), more alkaline water near limestones. 44.1°dH, very hard Sum of calcium and magnesium (7.88 mmol/l). Hard water is buffered and its pH changes more slowly; soft water is more sensitive to acid rain. 1,470mg/l mineralisation Total amount of dissolved minerals. Clean mountain water has tens of mg/l, lowland and limestone waters hundreds. Water type by dominant ions: Ca–Mg–SO₄–HCO₃ Shares are in equivalents, the usual way of comparing the composition of waters. dot: average along the water line, line: from the lowest to the highest value, scale: position among sample points on streams in Slovakia (0 to 100th percentile) The Geochemical Atlas of Slovakia (river sediments) describes what the river carries in the fine material on its bed. Sediment collects metals from rocks, ore occurrences and past mining and industry. It is not a legal limit or a health risk assessment: it shows how an element on this stream ranks among streams in Slovakia. dot: average along the water line, line: from the lowest to the highest value, scale: position among sample points on streams in Slovakia (0 to 100th percentile) Airborne gamma-ray spectrometry by ŠGÚDŠ measures radiation from potassium, uranium and thorium in rocks and soil. Granites and some acidic volcanic rocks have the highest values, limestones and floodplains the lowest. Caesium-137 is a remnant of fallout from the Chernobyl accident and nuclear weapons tests. 49nGy/h in air range 49 to 49 nGy/h Natural background from rocks and soil; higher over granites and some acidic volcanic rocks, lower over limestones and floodplains. low Radon is a natural gas from rocks. The risk concerns buildings and cellars, not the water in the stream; it shows what the bedrock is like. dot: average along the water line, line: from the lowest to the highest value, scale: position among sample points on streams in Slovakia (0 to 100th percentile) marker on the bar: share among all sample points on streams in Slovakia Maps of the magnetic field and gravity (ŠGÚDŠ) reveal what lies beneath the sediments and the surface: volcanic bodies, faults and crustal thickness. For an angler they are interesting indirectly: they show where the bedrock changes, and with it the water. -14nT range -38 to 23 nT Deviation of the Earth's magnetic field from its surroundings. Positive and negative anomalies reveal rocks with magnetite (basalts, basic volcanic rocks) and boundaries in the bedrock. +9mGal residual +4.8 mGal Negative values lie over thick sediments and under mountains (light crust), positive over dense rocks and thinner crust. It shows the structure of the Earth's crust, not the water. The Atlas of Geothermal Energy of Slovakia records rock temperature and heat flow from the Earth's interior. It is the potential of the area, not the actual warmth of the water in the stream. Specific geothermal boreholes and springs near this water are in the geothermal energy section below. 48 / 75 °Cat depths of 1,000 and 2,000 m increase of 27 °C per km The line shows the rock temperature; the dotted part is only an extension to the surface. Heat flow 65 mW/m². marker on the bar: share among all sample points on streams in Slovakia A basin is not just water: slope and elevation determine the speed of runoff, climate the temperature and amount of water, and soils what is washed into the stream. The data come from the geomorphological division, climatic-geographical types and soil maps of ŠGÚDŠ. marker on the bar: share among all sample points on streams in Slovakia marker on the bar: share among all sample points on streams in Slovakia marker on the bar: share among all sample points on streams in Slovakia marker on the bar: share among all sample points on streams in Slovakia marker on the bar: share among all sample points on streams in Slovakia marker on the bar: share among all sample points on streams in Slovakia Where the nearest mine workings, deposits, burdens, geothermal boreholes and gold finds are. Groups can be switched off. The line is the water of the fishing district, the light band is the 3 km zone in which boreholes, mine workings and burdens were searched for. The map shows the nearest objects (at most a few dozen from each register), not all of them. The points correspond to the position in the register; area objects are marked by their centre. Arsenic, antimony, cadmium, lead, copper, zinc and other elements in samples from rivers and streams (Geochemical Atlas of Slovakia, surface waters, 2015). The bar shows where the highest value lies among all samples in Slovakia; the light marker is the median of the samples at this water. Highest value: VAH2006, 500 m from the water. Comparison: percentile 99 of all samples in Slovakia. Highest value: Ižiansky kanál2010, 40 m from the water. Comparison: percentile 79 of all samples in Slovakia. Highest value: Ižiansky kanál2010, 40 m from the water. Comparison: percentile 75 of all samples in Slovakia. Highest value: Ižiansky kanál2010, 40 m from the water. Comparison: percentile 46 of all samples in Slovakia. Highest value: Ižiansky kanál2010, 40 m from the water. Comparison: percentile 43 of all samples in Slovakia. Highest value: Ižiansky kanál2010, 40 m from the water. Comparison: percentile 34 of all samples in Slovakia. Highest value: Ižiansky kanál2010, 40 m from the water. Comparison: percentile 32 of all samples in Slovakia. Highest value: Ižiansky kanál, 40 m from the water. Comparison: percentile 26 of all samples in Slovakia. Highest value: Ižiansky kanál2010, 40 m from the water. Comparison: percentile 22 of all samples in Slovakia. Basic water chemistry: which rocks the minerals in it come from. Highest value: bez mena, prítok Ižianskeho kanála2010, 80 m from the water. Comparison: percentile 65 of all samples in Slovakia. Hydrogeochemical objects (analyses of springs and boreholes), the geochemical atlas of groundwater (1996) and radiohydrochemical sampling. Groundwater feeds streams, so its composition also affects the water in the stream. Highest value: vrt1993, 2.0 km from the water. Comparison: percentile 99 of all samples in Slovakia. Highest value: studňa1993, 730 m from the water. Comparison: percentile 99 of all samples in Slovakia. Highest value: studňa1993, 190 m from the water. Comparison: percentile 99 of all samples in Slovakia. Highest value: vrt1993, 1.0 km from the water. Comparison: percentile 98 of all samples in Slovakia. Highest value: studňa1993, 190 m from the water. Comparison: percentile 97 of all samples in Slovakia. Highest value: vrt1993, 1.0 km from the water. Comparison: percentile 96 of all samples in Slovakia. Highest value: studňa1993, 190 m from the water. Comparison: percentile 96 of all samples in Slovakia. Highest value: studňa1993, 730 m from the water. Comparison: percentile 95 of all samples in Slovakia. Highest value: studňa1993, 2.1 km from the water. Comparison: percentile 94 of all samples in Slovakia. Highest value: vrt1993, 360 m from the water. Comparison: percentile 85 of all samples in Slovakia. Highest value: vrt1993, 1.0 km from the water. Comparison: percentile 50 of all samples in Slovakia. Highest value: vrt1993, 1.0 km from the water. Comparison: percentile 46 of all samples in Slovakia. Register of hydrogeological boreholes, other boreholes and geothermal boreholes. Each borehole has a report in the Geofond archive (geological profiles, pumping tests, chemical analyses of the water); the report number is in the table. 402 boreholes in the 3 km zone, of which 94 hydrogeological and 308 other; with an archive report number 401. Geothermal boreholes (wellhead water temperature, yield, chemical type) and sources of geothermal and mineral waters within 10 km. Data on the use and existence of a borehole come from the Geofond register. Recorded environmental burdens (industrial sites, landfills, mining), the register of waste landfills and monitoring of anthropogenic sediments (industrial sludge). It is a list of places, not a measurement of water pollution. Data: © ŠGÚDŠ (https://www.geology.sk), downloaded 8 Nov 2026. Details in the Methodology. Who manages the fishing districts and where they are Danube basin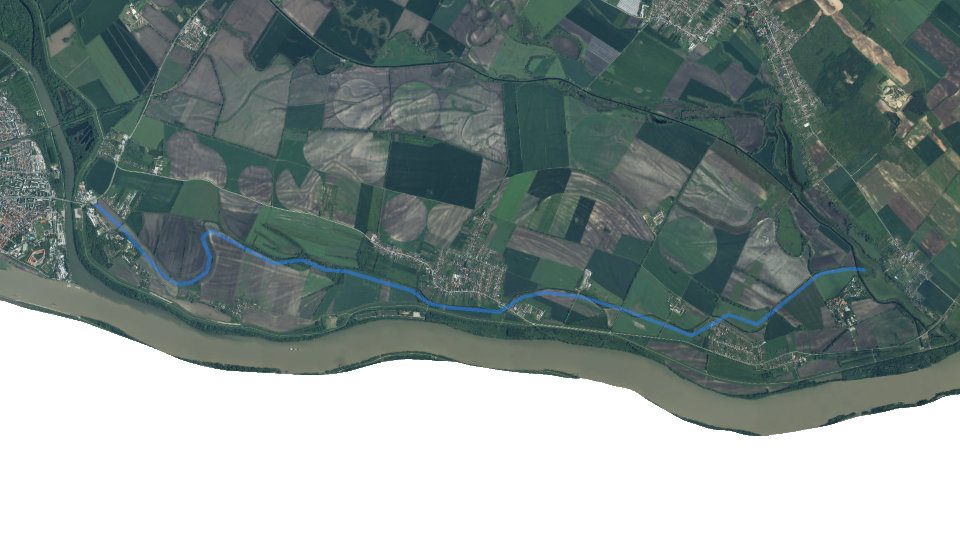
By the water now
Today on the Ižianský kanál watercourse
Average of the watercourse's fishing districts
Best window today
Map and fishing districts of the watercourse
Elevation profile: standing water
Terrain in 3D
Historical images
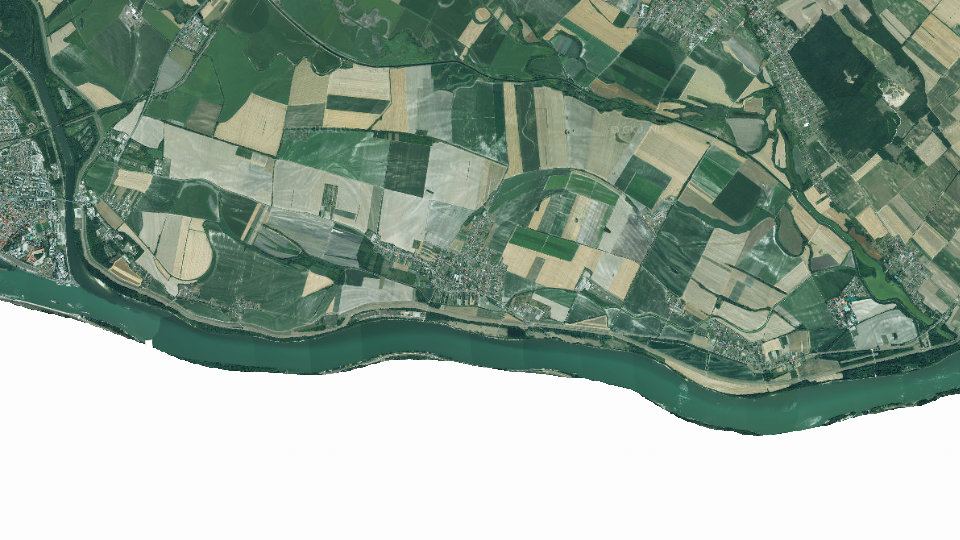
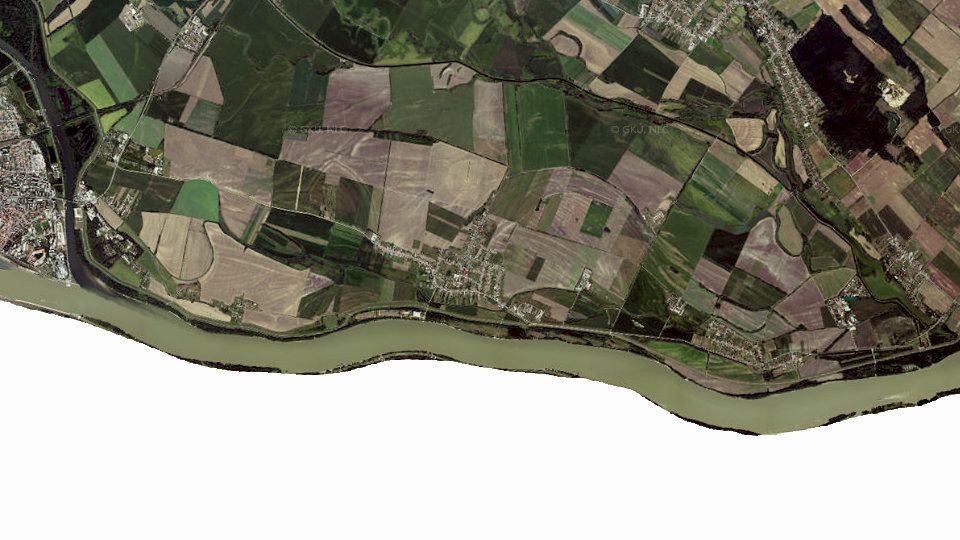

Water pollution on the Ižianský kanál watercourse
Surface water near the fishing districtsnearest SHMÚ monitoring site, 2025
Most polluted fishing districtsall with an unmet standard
Groundwater: measured valuestypical value from stations within 10 km, 2025
Geology and geochemistry of the Ižianský kanál stream
Rock under the water
Water according to the atlas
Elements in river sediment
Heat underfoot
Natural gamma radiation
Old mine workings
Gold in river sediment
Trace elements in the stream water
Boreholes and groundwater analyses
Geothermal energy
Environmental burdens and landfills
Deposits and ore occurrences
Landslides and slope deformations
Geological structure beneath the water
Geological age of the rocks
Most common rock units
System Age Unit Points Quaternary Holocene fluvial sediments: lithofacial undivided alluvial clays, or sandy to gravelly clays of valleys and floodplains 1× Quaternary Holocene fluvial sediments: resedimented alluvial sandy gravels of the near-channel zone 1× Quaternary cover
Tectonic division
Neotectonic units
Direction of neotectonic movements
Regional geological division
Regional geological division (subunits)
Engineering-geological districts
Engineering-geological formations
Susceptibility of the area to slope deformations
Hydrogeology: aquifers and groundwater
Aquifer rocks (hydrogeological map 1:200,000)
Aquifer type
Type of permeability (basic hydrogeological map 1:50,000)
Hydrogeological function
Main hydrogeological region
Genetic type of groundwater
Chemical type of groundwater
Groundwater quality class
Geothermal groundwater bodies
Surface water chemistry according to the atlas
Water acidity
Water hardness
Dissolved substances
Ionic composition of the water
Major ions
184 mg/lpercentile 98428 mg/lpercentile 9880.1 mg/lpercentile 97135 mg/lpercentile 95519 mg/lpercentile 9596.4 mg/lpercentile 950.245 mg/lpercentile 887.35 mg/lpercentile 86Nutrients and organic pollution
6.09 mg/lpercentile 880.466 mg/lpercentile 7911.9 mg/lpercentile 790.125 mg/lpercentile 54Metals
266 μg/lpercentile 920.161 mg/lpercentile 684.78 μg/lpercentile 3517.8 μg/lpercentile 16Elements in river sediments
Potentially toxic and trace elements
71.8 mg/kgpercentile 500.0944 mg/kgpercentile 466.22 mg/kgpercentile 4520.9 mg/kgpercentile 3713.5 mg/kgpercentile 370.0875 mg/kgpercentile 211.97 mg/kgpercentile 2017.1 mg/kgpercentile 186.19 mg/kgpercentile 170.130 mg/kgpercentile 1566.1 mg/kgpercentile 140.327 mg/kgpercentile 140.149 mg/kgpercentile 944.2 mg/kgpercentile 50.0748 mg/kgpercentile 4Major elements (iron, aluminium, calcium, magnesium, potassium, sodium, titanium, manganese, phosphorus)
2.19 %percentile 907.24 %percentile 890.882 %percentile 534,056 mg/kgpercentile 34697 mg/kgpercentile 32701 mg/kgpercentile 302.20 %percentile 214.09 %percentile 61.08 %percentile 5Further elements (barium, strontium, lithium, rubidium, zirconium, yttrium, cerium, boron, beryllium, gallium)
185 mg/kgpercentile 8162.3 mg/kgpercentile 61365 mg/kgpercentile 370.966 mg/kgpercentile 2618.5 mg/kgpercentile 1138.9 mg/kgpercentile 106.35 mg/kgpercentile 559.0 mg/kgpercentile 5279 mg/kgpercentile 518.3 mg/kgpercentile 4Natural radioactivity and radon
Gamma radiation dose rate
Radon risk of the bedrock
2.60 ppm55th percentile1.28 %percentile 407.09 ppm39th percentile2,606 Bq/m²percentile 82Radon risk by isopleths
Geophysical fields: magnetics and gravity
Magnetic anomaly
Bouguer gravity anomaly
Geothermal potential
Rock temperature with depth
Geothermal groundwater bodies beneath the water line
Relief, climate and soils
Geomorphological units
Geomorphological regions
Climatic-geographical types
Susceptibility of soils to acidification
Soil contamination (map 1:500,000)
Lithogeochemical types
Map of the corridor
Trace elements in surface waters
Major ions, mineralisation and pH
Groundwater: chemistry, water types and radioactivity
Chemical water types nearby
Water quality class according to the hydrogeochemical map
Metals in groundwater
Radon in waters
Type of site Samples Highest radon Median well 3 64,6 Bq/l 14.2 Bq/l free-flowing borehole with thermal and mineral water 1 3,60 Bq/l 3.60 Bq/l Boreholes and Geofond archive reports
Borehole depths
Nearest boreholes
Site Type Depth Archive report From the water Iž-125 deposit – 1487940 m Iža-Patince wide-diameter borehole 14.5 m 36957 1Dc12.pdf50 m 1204 hydrogeological 14.0 m 1224050 m Patince narrow-diameter borehole with ordinary drinking and process water 70.0 m 75667 1Dc22.pdf60 m 79-4 engineering-geological 14.5 m 1892360 m 89-8 engineering-geological 3.2 m 1892360 m Patince narrow-diameter borehole with ordinary drinking and process water 14.0 m 15770 1Dc8.pdf70 m Iža-Patince wide-diameter borehole 13.0 m 36957 1Dc14.pdf70 m 92-8 engineering-geological 5.6 m 1892370 m Patince narrow-diameter borehole with ordinary drinking and process water 65.0 m 67036 1Dc21.pdf80 m 87-2 engineering-geological 3.3 m 1892380 m Patince wide-diameter borehole 12.0 m 36957 1Dc13.pdf90 m Geothermal energy and mineral waters
Borehole Temperature Yield Depth Chemical water type Use From the water Virt – HVB-1 26 °C – 241 m Ca-Mg-HCO3 in use without data reporting 500 m Patince – SB-1 26 °C 29.1 l/s 226 m Ca-Mg-HCO3 unused 540 m Virt – JRD 26 °C 6.6 l/s 260 m Ca-Mg-HCO3 unused 550 m Patince – SB-2 27 °C 45.0 l/s 160 m Ca-Mg-HCO3 in use 550 m Patince – SB-3 26 °C 29.4 l/s 170 m Ca-Mg-HCO3 unused 560 m Virt – vrt VŠE 24 °C – 280 m Ca-Mg-HCO3 in use without data reporting 800 m Komárno – M-2 42 °C – 1060 m Na-HCO3-Cl in use without data reporting 1.1 km Komárno – M-3 51 °C 5.0 l/s 1184 m Ca-Na-Mg-SO4-Cl-HCO3 1.1 km Komárno – M-3 36 °C 0.9 l/s 806 m Na-HCO3 in use without data reporting 1.1 km Komárno – M-1 42 °C 1.6 l/s 1221 m Na-Ca-Mg-SO4-HCO3-Cl unused 1.1 km Sources of geothermal and mineral waters
Source Type Water temperature (°C) Yield (l/s) Count Nearest from water JRD, VŠE geothermal water 22 – 38 16 – 30 1 400 m M-1,2,3 geothermal water 38 – 55 < 5 1 1.1 km HVB-1 geothermal water 22 – 38 16 – 30 1 1.4 km category d2 mineral water 39-55 5-15 1 1.6 km category d3 mineral water 39-55 16-30 1 1.7 km category Komárno thermal baths – – 1 1.7 km category c1 mineral water 23-38 < 5 1 1.9 km category c2 mineral water 23-38 5-15 1 2.0 km category c3 mineral water 23-38 16-30 1 2.1 km category Patince thermal baths – – 1 2.1 km Environmental burdens, landfills and anthropogenic sediments
Environmental burdens
Site Activity Substance Classification From the water Komárno – Harčáš SK1000600P 410 m Komárno – Madzagoš SK1000600P 1.1 km Komárno – areál po Sovietskej armáde SK1000200P 1.2 km Komárno – SPP Bratislava SK1000200P 1.8 km Komárno – rušňové depo, CARGO a.s. SK1000300P 2.1 km Waste landfills
Landfill Area Year established Monitoring From the water Landfill odpadu REKO Iža – Bokroš – Iža 470 000 m² 1994 monitored 210 m Landfill TKO – Harčáš (bývalá skládka)) – Komárno 25 000 m² – monitored 410 m Nová Novozámocká cesta, landfill TKO (bývalá skládka) – Komárno 8 424 m² 1994 monitored 1.2 km Komárno – SV, za Váh – hrádza/žel. – Komárno 1 155 m² – – 1.5 km 1,5 km za Váhom – Komárno 2 230 m² – – 1.8 km How to read these data
Organizations and location
Organizations on the watercoursewho manages the fishing districts and what the conditions are there today
More watercourses nearby
9from 100
1445fishing districts
Map color
Loading map…
lowerhigher
Cations (positive ions)
Anions (negative ions)
StrontiumSrextreme (top 1 %)
highest 3,200 μg/lmedian 3,200 μg/l1 sample
BariumBaslightly elevated
highest 73.0 μg/lmedian 64.0 μg/l2 samples
ArsenicAsslightly elevated
highest 2.00 μg/lmedian 2.00 μg/l2 samples
SeleniumSebelow half of Slovakia
highest 0.500 μg/lmedian 0.500 μg/l2 samples100 % below the limit of quantification
LeadPbbelow half of Slovakia
highest 2.50 μg/lmedian 2.50 μg/l2 samples100 % below the limit of quantification
LithiumLibelow half of Slovakia
highest 5.00 μg/lmedian 5.00 μg/l2 samples100 % below the limit of quantification
ChromiumCrbelow half of Slovakia
highest 1.00 μg/lmedian 1.00 μg/l2 samples100 % below the limit of quantification
CadmiumCdbelow half of Slovakia
highest 0.150 μg/lmedian 0.150 μg/l2 samples100 % below the limit of quantification
CopperCubelow half of Slovakia
highest 1.00 μg/lmedian 1.00 μg/l2 samples100 % below the limit of quantification
Silicon dioxideSiO2typical value
highest 15.0 mg/lmedian 14.4 mg/l2 samples
LeadPbextreme (top 1 %)
highest 21.0 μg/lmedian 1.00 μg/l22 samples41 % below the limit of quantification
ZincZnextreme (top 1 %)
highest 15,600 μg/lmedian 282 μg/l22 samples5 % below the limit of quantification
CopperCuextreme (top 1 %)
highest 16.0 μg/lmedian 1.95 μg/l22 samples
SeleniumSehigh (top 5 %)
highest 5.70 μg/lmedian 0.500 μg/l22 samples68 % below the limit of quantification
ArsenicAshigh (top 5 %)
highest 9.50 μg/lmedian 0.500 μg/l22 samples68 % below the limit of quantification
LithiumLihigh (top 5 %)
highest 75.0 μg/lmedian 13.0 μg/l22 samples
AntimonySbhigh (top 5 %)
highest 1.20 μg/lmedian 0.100 μg/l22 samples64 % below the limit of quantification
CadmiumCdhigh (top 5 %)
highest 0.500 μg/lmedian 0.250 μg/l22 samples95 % below the limit of quantification
ChromiumCrelevated (top 10 %)
highest 3.30 μg/lmedian 0.900 μg/l22 samples27 % below the limit of quantification
AluminiumAlslightly elevated
highest 0.0300 mg/lmedian 0.00500 mg/l22 samples68 % below the limit of quantification
IronFetypical value
highest 0.00500 mg/lmedian 0.00500 mg/l11 samples100 % below the limit of quantification
MercuryHgbelow half of Slovakia
highest 0.100 μg/lmedian 0.100 μg/l22 samples100 % below the limit of quantification