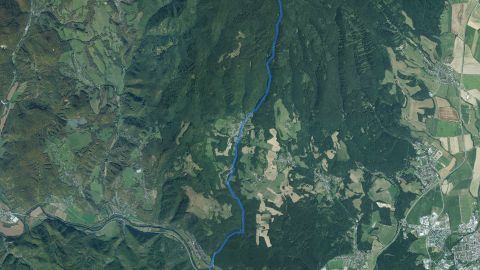
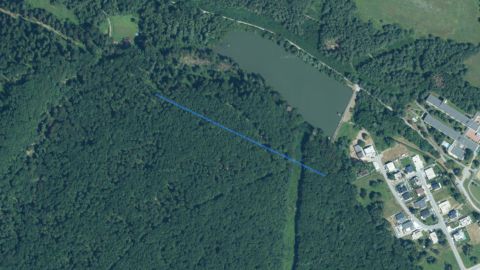
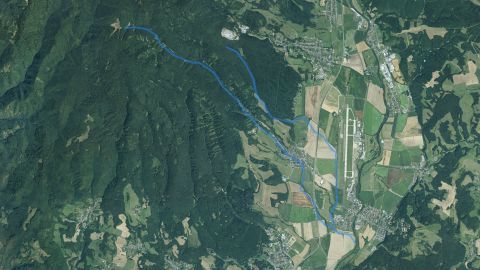
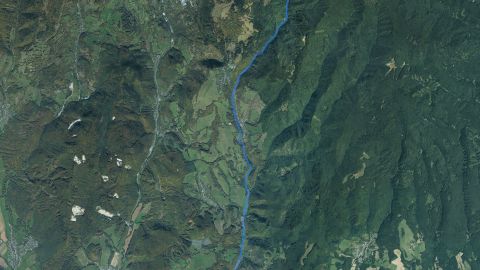
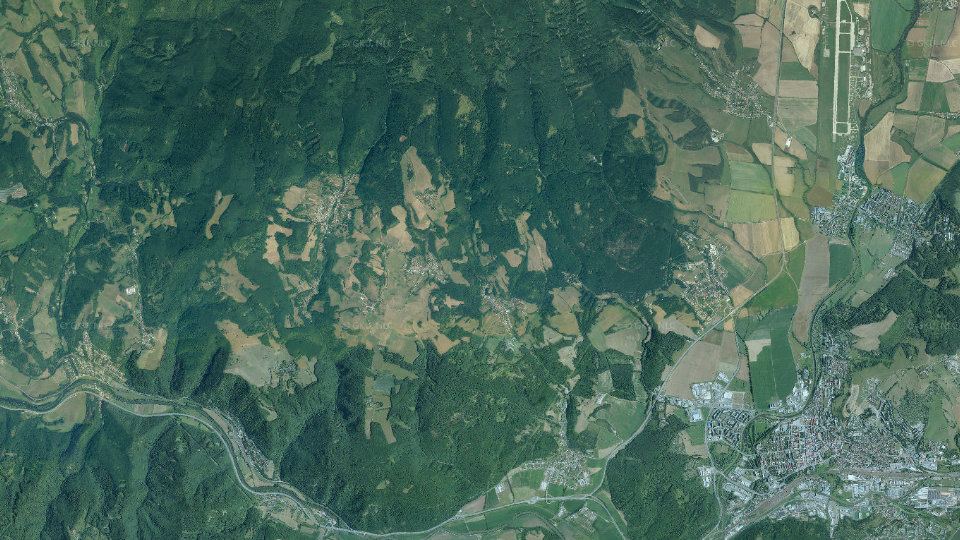
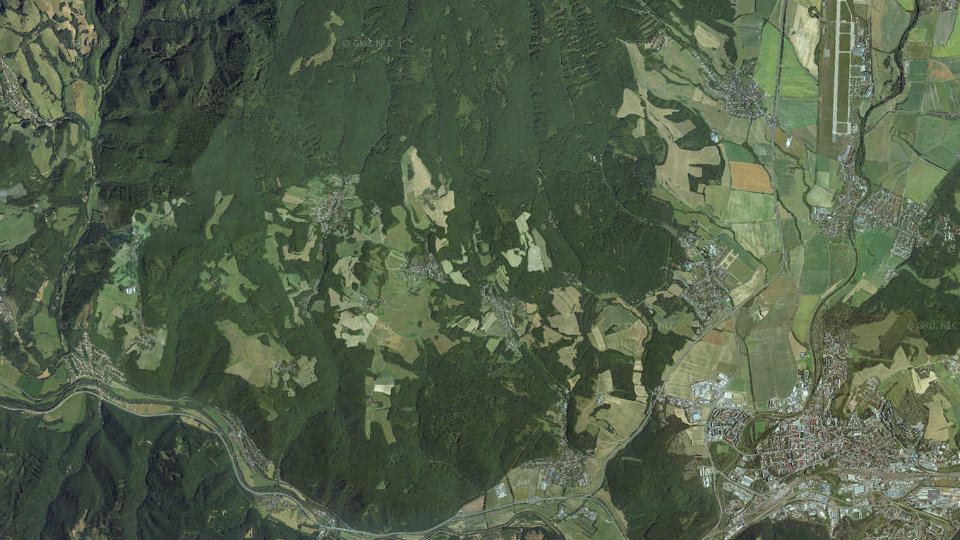
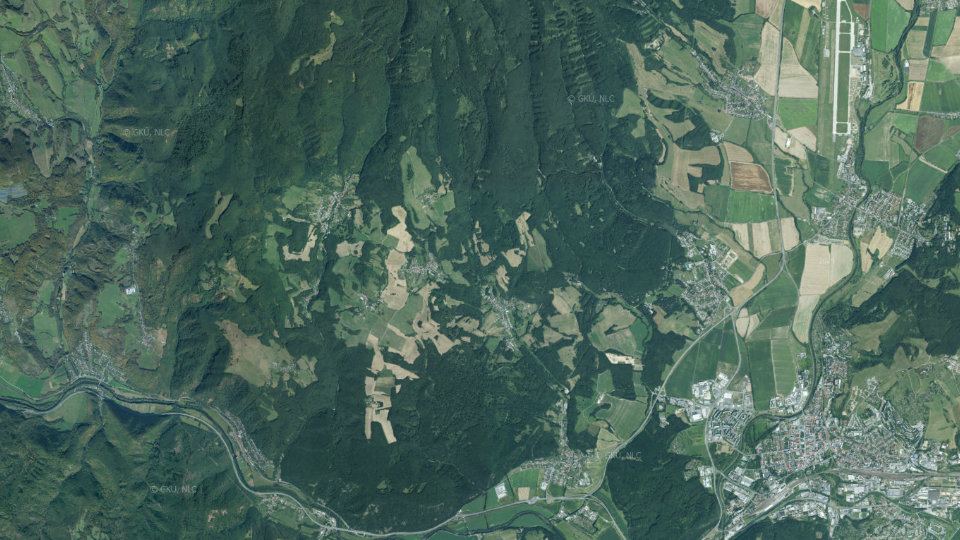
Fishing conditions score, the best window of the day and fishing districts from the best conditions Low activity · average of one fishing district 06:00–08:00 Turová, window score 30. The score is an estimate of conditions based on weather, water and surroundings, not a bite forecast. Recalculated at 03:04. The course of the watercourse and its fishing districts. You can switch the line color to today's conditions, quality or any other parameter. Detailed filtersregion, district, riverbed, depth, shading, satellites, water chemistry and pollution, fish, geology Move the map with two fingers. In full-screen mode one finger is enough. The score is an estimate of conditions based on weather, water and surroundings, not a bite forecast. For each fishing district you can see what it is made of, how well it is supported by data and where the data comes from. How the watercourse falls downstream: fall, gradient and water speed. Bystrina A mountain stream with a steep gradient, cascades and a rocky bottom. The water is clear and cold; fishing requires a careful approach. Source: Open Topo Data (eudem25m), 4 Nov 2026. Gradient and fall are approximate and include only the sections of fishing districts. Loading the 3D terrain model… Changes in the surroundings and nature from 2018 to 2024: how the banks, vegetation and landscape around the water change. The images switch automatically; you can also browse them by hand. Orthophoto mosaic of Slovakia © GKÚ Bratislava, NLC Zvolen. The year and day of imaging depend on the location, so individual years may differ in season and weather. Water quality according to SHMÚ, wastewater treatment plants near the fishing districts and groundwater nearby 1 of 1 fishing district with measurements has groundwater nearby with a value above the limit for at least one indicator. Source: SHMÚ (yearbooks on surface and groundwater quality), the register of wastewater treatment plants from VÚVH and the EEA. A SHMÚ site is assigned to a fishing district by the same watercourse name and by distance; the yearbook lists the sites that failed the standard, so a missing site is not proof of clean water. Kovy a zlato v riečnych sedimentoch a vode, staré banské diela a ložiská, vrty s archívnymi správami, geotermálna energia, záťaže a zosuvy v okolí toku Prehľad vychádza z verejných registrov a atlasov Štátneho geologického ústavu Dionýza Štúra. Hľadá sa v pásme okolo vody všetkých revírov toku (spolu 10 km čiary): vzorky z potokov do 1 km, vrty, banské diela a záťaže do 3 km, rudné výskyty do 5 km, geotermálne zdroje do 10 km. Young sediments50% of the water line 50% volcanic rocks Young unconsolidated sediments; fine material easily washes into the stream during rain. Geological Map of Slovakia 1:50,000. pH 7.8modelled estimate water type Ca–Mg–HCO₃ Mineralisation 152 mg/l, soft water (4.4 °dH). Interpolation of measurements from the Geochemical Atlas of Slovakia, not a measurement in the stream. 2 from 15elements in the top 10 % highest: Cobalt 14.9 mg/kg Position of the highest-ranked element among the sample points on streams in Slovakia: percentile 94. Interpolation of the Geochemical Atlas of river sediments. 45°C at 1,000 m depth heat flow 95 mW/m² At a depth of 2,000 m about 75 °C (increase of 30 °C per kilometre). Atlas of Geothermal Energy of Slovakia. 45nGy/h dose rate percentile 17 in Slovakia Natural background from rocks and soil (potassium, uranium, thorium), not a value measured at the water. Airborne gamma-ray spectrometry by ŠGÚDŠ. 40objektov do 3 km ťažené: Fe Najbližšie: Pinga (pinga, pingový ťah), 400 m od vody. 1vzorka so zlatom 15 rudných minerálov v sedimente Najviac 1 zrno v jednej vzorke (720 m od vody). Šlichová prospekcia rátala zlaté zrná v preparáte z riečneho sedimentu. 2 from 10indicators in the top 5 % highest: Arsenic 19.0 μg/l Poloha najvyššej namerenej hodnoty v rozdelení všetkých vzoriek povrchových vôd na Slovensku: 98. percentil (Gunda-ľavostranný prítok Hrona od hl.cesty). 103vrtov do 3 km 408 rozborov vody v okolí Z toho 102 s archívnou správou Geofondu. Vrty sú hydrogeologické, geologické, inžinierskogeologické a iné. 49°C na ústí vrtu 19 geotermálnych vrtov do 10 km Najteplejší: Kováčová – K-1, výdatnosť 50,0 l/s, 3,6 km od vody. 6lokalít do 3 km 1 záťaž, 5 skládok Najbližšia záťaž: Zvolen – armádne objekty, 3,0 km od vody. Blízkosť neznamená, že látky z lokality do vody unikajú. 9záznamov do 5 km 4 ložiská, 5 rudných výskytov Registre Geofondu, metalogenetická mapa a mapa nerastných surovín. 76plôch do 3 km 13 aktívnych Zdokumentované zosuvy v registri Geofondu. Zosuv do toku môže zakaliť vodu a zmeniť dno. Which rock lies beneath the water line (Geological Map of Slovakia 1:50,000), how old it is, how thick the Quaternary cover is and in which tectonic unit the water flows. The bedrock decides the hardness of the water, the bottom, the turbidity after rain and the abundance of springs. The points follow the water line (for a stream and a basin, fishing district after fishing district). The strip is a cross-section by distance, not a map; the width of a section corresponds to the number of points. marker on the bar: share among all sample points on streams in Slovakia Young sediments: Young unconsolidated sediments; fine material easily washes into the stream during rain. marker on the bar: share among all sample points on streams in Slovakia marker on the bar: share among all sample points on streams in Slovakia marker on the bar: share among all sample points on streams in Slovakia marker on the bar: share among all sample points on streams in Slovakia marker on the bar: share among all sample points on streams in Slovakia The map covers 2 of 5 points on the water line. Streams and rivers are fed by groundwater. Hydrogeological maps show in which rocks the water is stored, how permeable they are and what the water in them is like. The data come from ŠGÚDŠ maps, not from measurements at a particular water. marker on the bar: share among all sample points on streams in Slovakia marker on the bar: share among all sample points on streams in Slovakia marker on the bar: share among all sample points on streams in Slovakia marker on the bar: share among all sample points on streams in Slovakia marker on the bar: share among all sample points on streams in Slovakia marker on the bar: share among all sample points on streams in Slovakia Modelled composition of the water in the area the fishing district line runs through. The rasters of the Geochemical Atlas of Slovakia (surface waters) are an interpolation of measurements in sampled streams, so they show the typical background of the area, not a measurement in a particular stream. pH 7.75typical range Most rivers and streams in Slovakia have a pH of 6.5 to 8.5. More acidic water is found in streams on acidic rocks (granites, quartzites), more alkaline water near limestones. 4.4°dH, soft Sum of calcium and magnesium (0.79 mmol/l). Hard water is buffered and its pH changes more slowly; soft water is more sensitive to acid rain. 152mg/l mineralisation Total amount of dissolved minerals. Clean mountain water has tens of mg/l, lowland and limestone waters hundreds. Water type by dominant ions: Ca–Mg–HCO₃ Shares are in equivalents, the usual way of comparing the composition of waters. dot: average along the water line, line: from the lowest to the highest value, scale: position among sample points on streams in Slovakia (0 to 100th percentile) The Geochemical Atlas of Slovakia (river sediments) describes what the river carries in the fine material on its bed. Sediment collects metals from rocks, ore occurrences and past mining and industry. It is not a legal limit or a health risk assessment: it shows how an element on this stream ranks among streams in Slovakia. dot: average along the water line, line: from the lowest to the highest value, scale: position among sample points on streams in Slovakia (0 to 100th percentile) Airborne gamma-ray spectrometry by ŠGÚDŠ measures radiation from potassium, uranium and thorium in rocks and soil. Granites and some acidic volcanic rocks have the highest values, limestones and floodplains the lowest. Caesium-137 is a remnant of fallout from the Chernobyl accident and nuclear weapons tests. 45nGy/h in air range 40 to 50 nGy/h Natural background from rocks and soil; higher over granites and some acidic volcanic rocks, lower over limestones and floodplains. dot: average along the water line, line: from the lowest to the highest value, scale: position among sample points on streams in Slovakia (0 to 100th percentile) The Atlas of Geothermal Energy of Slovakia records rock temperature and heat flow from the Earth's interior. It is the potential of the area, not the actual warmth of the water in the stream. Specific geothermal boreholes and springs near this water are in the geothermal energy section below. 45 / 75 °Cat depths of 1,000 and 2,000 m increase of 30 °C per km The line shows the rock temperature; the dotted part is only an extension to the surface. Heat flow 95 mW/m². marker on the bar: share among all sample points on streams in Slovakia A basin is not just water: slope and elevation determine the speed of runoff, climate the temperature and amount of water, and soils what is washed into the stream. The data come from the geomorphological division, climatic-geographical types and soil maps of ŠGÚDŠ. marker on the bar: share among all sample points on streams in Slovakia Where the nearest mine workings, deposits, burdens, geothermal boreholes and gold finds are. Groups can be switched off. Čiara je voda revíru, svetlý pás je pásmo 3 km, v ktorom sa hľadali vrty, banské diela a záťaže. Mapa ukazuje najbližšie objekty (najviac niekoľko desiatok z každého registra), nie všetky. Body zodpovedajú polohe v registri; plošné objekty sú vyznačené stredom. Arzén, antimón, kadmium, olovo, meď, zinok a ďalšie prvky vo vzorkách riek a potokov (Geochemický atlas SR, povrchové vody, 2015). Pruh ukazuje, kde najvyššia hodnota leží medzi všetkými vzorkami na Slovensku; svetlá značka je medián vzoriek pri tejto vode. Najvyššia hodnota: Gunda-ľavostranný prítok Hrona od hl.cesty, 1997, 720 m od vody. Porovnanie: 98. percentil všetkých vzoriek na Slovensku. Najvyššia hodnota: Gunda-ľavostranný prítok Hrona od hl.cesty, 1997, 720 m od vody. Porovnanie: 95. percentil všetkých vzoriek na Slovensku. Najvyššia hodnota: Budča-Turová-sútok s pravostran. prítokom, 1997, 70 m od vody. Porovnanie: 81. percentil všetkých vzoriek na Slovensku. Najvyššia hodnota: 600m JZ od K819, 750 m od vody. Porovnanie: 75. percentil všetkých vzoriek na Slovensku. Najvyššia hodnota: Budča-Turová-sútok s pravostran. prítokom, 1997, 70 m od vody. Porovnanie: 63. percentil všetkých vzoriek na Slovensku. Najvyššia hodnota: Gunda-ľavostranný prítok Hrona od hl.cesty, 1997, 720 m od vody. Porovnanie: 46. percentil všetkých vzoriek na Slovensku. Najvyššia hodnota: 600m JZ od K819, 1993, 750 m od vody. Porovnanie: 43. percentil všetkých vzoriek na Slovensku. Najvyššia hodnota: Gunda-ľavostranný prítok Hrona od hl.cesty, 1997, 720 m od vody. Porovnanie: 34. percentil všetkých vzoriek na Slovensku. Najvyššia hodnota: 600m JZ od K819, 1993, 750 m od vody. Porovnanie: 22. percentil všetkých vzoriek na Slovensku. Najvyššia hodnota: 600m JZ od K819, 1993, 750 m od vody. Porovnanie: 16. percentil všetkých vzoriek na Slovensku. Základný chemizmus vody: z akých hornín sa do nej dostávajú minerály. Najvyššia hodnota: šiesty most po prúde od vzorky GV-81, 1997, 70 m od vody. Porovnanie: 98. percentil všetkých vzoriek na Slovensku. Regionálna šlichová prospekcia: z riečneho štrku sa vymyl ťažký podiel a spočítali sa v ňom zrná minerálov. Mapa nálezov je pozitívna: vzorka bez zlata sa v atlase neuvádza, preto absencia nálezu nie je dôkaz, že zlato nie je. Hydrogeochemické objekty (rozbory prameňov a vrtov), geochemický atlas podzemných vôd (1996) a rádiohydrochemické vzorkovanie. Podzemná voda živí potoky, preto jej zloženie ovplyvňuje aj vodu v toku. Najvyššia hodnota: prameň, 1991, 1,7 km od vody. Porovnanie: 99. percentil všetkých vzoriek na Slovensku. Najvyššia hodnota: prameň, 1991, 1,7 km od vody. Porovnanie: 99. percentil všetkých vzoriek na Slovensku. Najvyššia hodnota: studňa, 1991, 270 m od vody. Porovnanie: 99. percentil všetkých vzoriek na Slovensku. Najvyššia hodnota: studňa, 1991, 80 m od vody. Porovnanie: 98. percentil všetkých vzoriek na Slovensku. Najvyššia hodnota: studňa, 1991, 80 m od vody. Porovnanie: 96. percentil všetkých vzoriek na Slovensku. Najvyššia hodnota: vrt, 1991, 1,5 km od vody. Porovnanie: 96. percentil všetkých vzoriek na Slovensku. Najvyššia hodnota: prameň, 1991, 2,9 km od vody. Porovnanie: 83. percentil všetkých vzoriek na Slovensku. Najvyššia hodnota: vrt, 1991, 1,5 km od vody. Porovnanie: 78. percentil všetkých vzoriek na Slovensku. Najvyššia hodnota: vrt, 1991, 1,7 km od vody. Porovnanie: 75. percentil všetkých vzoriek na Slovensku. Najvyššia hodnota: studňa, 1991, 460 m od vody. Porovnanie: 69. percentil všetkých vzoriek na Slovensku. Najvyššia hodnota: studňa, 1991, 2,3 km od vody. Porovnanie: 50. percentil všetkých vzoriek na Slovensku. Najvyššia hodnota: studňa, 1991, 2,3 km od vody. Porovnanie: 46. percentil všetkých vzoriek na Slovensku. Staré banské diela mimo dobývacích priestorov (register Geofondu), ložiská a dobývacie priestory a metalogenetická mapa. Zlato, striebro a ďalšie kovy sa v blízkosti tokov môžu dostávať do sedimentov a vody. Register hydrogeologických vrtov, ostatných vrtov a geotermálnych vrtov. Ku každému vrtu patrí správa v archíve Geofondu (geologické profily, čerpacie skúšky, chemické rozbory vody); číslo správy je v tabuľke. 103 vrtov v pásme 3 km, z toho 40 hydrogeologických a 63 ostatných; s číslom archívnej správy 102. Geotermálne vrty (teplota vody na ústí, výdatnosť, chemický typ) a zdroje geotermálnych a minerálnych vôd v okruhu 10 km. Údaje o využívaní a existencii vrtu sú z registra Geofondu. Evidované environmentálne záťaže (priemyselné areály, skládky, ťažba), register skládok odpadov a monitorovanie antropogénnych sedimentov (kaly z priemyslu). Je to zoznam miest, nie meranie znečistenia vody. Register zdokumentovaných svahových deformácií (Geofond). Zosuvy pri toku môžu priniesť do vody jemný materiál, zmeniť dno a prehradiť koryto. Dáta: © ŠGÚDŠ (https://www.geology.sk), stiahnuté 8. 11. 2026. Podrobnosti v Metodike. Who manages the fishing districts and where they are Hron basin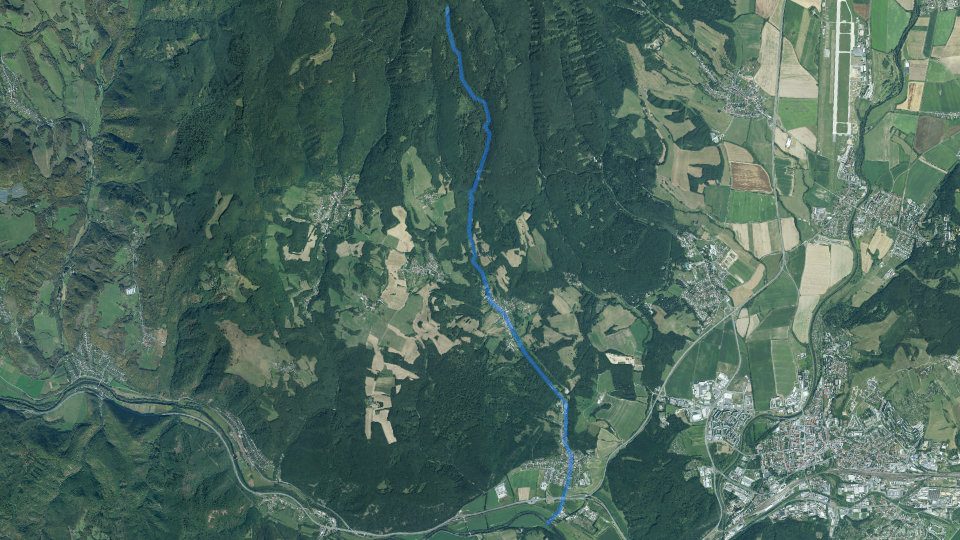
By the water now
Today on the Turová watercourse
Average of the watercourse's fishing districts
Best window today
Map and fishing districts of the watercourse
Elevation profile of the watercourse
Terrain in 3D
Historical images
Water pollution on the Turová watercourse
Groundwater: measured valuestypical value from stations within 10 km, 2025
Geológia a geochémia toku Turová
Rock under the water
Water according to the atlas
Elements in river sediment
Heat underfoot
Natural gamma radiation
Old mine workings
Gold in river sediment
Trace elements in the stream water
Boreholes and groundwater analyses
Geothermal energy
Environmental burdens and landfills
Deposits and ore occurrences
Landslides and slope deformations
Geological structure beneath the water
Geological age of the rocks
Most common rock units
System Age Unit Points kvartér pleistocén – holocén zosuvy 1× neovulkanity stredný miocén formácie: inovecká, sielnická, turovská; komplex Jabloňového vrchu 1× Quaternary cover
Tectonic division
Neotectonic units
Direction of neotectonic movements
Hydrogeology: aquifers and groundwater
Aquifer rocks (hydrogeological map 1:200,000)
Aquifer type
Type of permeability (basic hydrogeological map 1:50,000)
Hydrogeological function
Main hydrogeological region
Geothermal groundwater bodies
Surface water chemistry according to the atlas
Water acidity
Water hardness
Dissolved substances
Ionic composition of the water
Major ions
3.91 mg/l63. percentil0.120 mg/l53. percentil6.28 mg/l36. percentil4.58 mg/l31. percentil6.03 mg/l15. percentil19.5 mg/l14. percentil83.0 mg/l14. percentil21.7 mg/l11. percentilNutrients and organic pollution
0.684 mg/l88. percentil3.96 mg/l66. percentil0.180 mg/l66. percentil5.71 mg/l45. percentilMetals
244 μg/l84. percentil0.221 mg/l77. percentil12.7 μg/l73. percentil44.8 μg/l59. percentilElements in river sediments
Potentially toxic and trace elements
14.9 mg/kg94. percentil117 mg/kg93. percentil0.450 mg/kg88. percentil180 mg/kg87. percentil29.1 mg/kg86. percentil2.27 mg/kg84. percentil32.2 mg/kg75. percentil3.43 mg/kg73. percentil0.291 mg/kg70. percentil0.269 mg/kg67. percentil8.06 mg/kg65. percentil0.276 mg/kg57. percentil0.204 mg/kg16. percentil43.8 mg/kg10. percentil12.4 mg/kg7. percentilMajor elements (iron, aluminium, calcium, magnesium, potassium, sodium, titanium, manganese, phosphorus)
7,036 mg/kg92. percentil4.14 %92. percentil1,468 mg/kg88. percentil6.88 %84. percentil993 mg/kg67. percentil0.938 %55. percentil0.852 %47. percentil1.88 %46. percentil1.11 %6. percentilFurther elements (barium, strontium, lithium, rubidium, zirconium, yttrium, cerium, boron, beryllium, gallium)
39.1 mg/kg92. percentil18.7 mg/kg85. percentil528 mg/kg76. percentil168 mg/kg74. percentil380 mg/kg42. percentil1.20 mg/kg38. percentil83.9 mg/kg37. percentil53.1 mg/kg28. percentil36.7 mg/kg8. percentil20.7 mg/kg7. percentilNatural radioactivity and radon
Gamma radiation dose rate
2.58 ppm49. percentil1.21 %21. percentil5.95 ppm9. percentilGeothermal potential
Rock temperature with depth
Geothermal groundwater bodies beneath the water line
Relief, climate and soils
Climatic-geographical types
Map of the corridor
Trace elements in surface waters
Major ions, mineralisation and pH
Gold and ore minerals in river sediments
Nearest samples with gold
Sample Gold in sample From the water 304/C 1 zrno 720 m Rock-forming and accessory minerals
Groundwater: chemistry, water types and radioactivity
Metals in groundwater
Radon in waters
Type of site Samples Highest radon Median minerálny prameň 1 4.67 Bq/l 4,67 Bq/l source 13 42.0 Bq/l 7,06 Bq/l vodný zdroj pre individuálne zásobovanie 4 27.0 Bq/l 14,9 Bq/l vodný zdroj pre hromadné zásobovanie 1 4.57 Bq/l 4,57 Bq/l Mine workings, deposits and ore occurrences
What was mined here (according to the register of old mine workings)
Types of mining objects
Nearest old mine workings
Name Type Mined Ended From the water Pinga pinga, pingový ťah uhlie 400 m Pinga pinga, pingový ťah uhlie 400 m Halda halda uhlie 400 m Pinga pinga, pingový ťah uhlie 400 m Štôlňa štôlňa uhlie 410 m Pinga pinga, pingový ťah uhlie 410 m Halda halda uhlie 420 m Pinga pinga, pingový ťah uhlie 420 m Pinga pinga, pingový ťah uhlie 420 m Halda halda uhlie 420 m Deposits and mining areas
Deposit Mineral Status and organisation From the water Ostrá Lúka stavebný kameň Ložisko s predpokladom využívania zásob – Organizácia neurčená 1.9 km Ostrá Lúka stavebný kameň Ložisko s predpokladom využívania zásob – Organizácia neurčená 1.9 km Badín – Skalica stavebný kameň Ťažené ložisko – Resale SE 4.0 km Badín – Skalica stavebný kameň Ťažené ložisko – Resale SE 4.1 km Ore occurrences in the metallogenic map
Occurrence Ore type Metals Type From the water Železná Breznica Železné rudy Fe mineralogický výskyt 1.8 km Boreholes and Geofond archive reports
Borehole depths
Nearest boreholes
Site Type Depth Archive report From the water VTU-7/89 ložiskový 92.0 m 7751630 m VTU-8/89 ložiskový 100.0 m 7751680 m JB-2 inžiniersko-geologický 6.0 m 85974100 m JB-3 inžiniersko-geologický 6.0 m 85974130 m JB-1 inžiniersko-geologický 6.0 m 85974140 m 3-260 Budča hydrogeologický 8.0 m 101748140 m 3-801 Budča hydrogeologický 46.0 m 101748150 m Budča úzkoprofilový vrt s obyčajnou pitnou a úžitkovou vodou 22.4 m 4195 123Ac11.pdf240 m VTU-5/89 ložiskový 80.0 m 77516270 m J-2 inžiniersko-geologický 7.0 m 86211360 m J-4 inžiniersko-geologický 7.2 m 86211360 m VTU-3/89 ložiskový 80.0 m 77516370 m Geothermal energy and mineral waters
Borehole Temperature Yield Depth Chemical water type Use From the water Kováčová – K-2 46 °C 20.0 l/s 536 m Ca-SO4, resp. Ca-Mg-SO4 využívaný 3.5 km Kováčová – P-3 42 °C – 9 m Ca-SO4, resp. Ca-Mg-SO4 nevyužívaný 3.6 km Kováčová – P-7 12 °C – 9 m Ca-SO4, resp. Ca-Mg-SO4 nevyužívaný 3.6 km Kováčová – P-6 25 °C – 9 m Ca-SO4, resp. Ca-Mg-SO4 nevyužívaný 3.6 km Kováčová 46 °C 20.0 l/s 412 m Ca-SO4, resp. Ca-Mg-SO4 nevyužívaný 3.6 km Kováčová – P-4 41 °C – 9 m Ca-SO4, resp. Ca-Mg-SO4 nevyužívaný 3.6 km Kováčová – K-1 49 °C 50.0 l/s 512 m Ca-SO4, resp. Ca-Mg-SO4 nevyužívaný 3.6 km Sielnica – KMV-1 33 °C 3.0 l/s 417 m Ca-SO4 využívaný 4.1 km Sielnica – BO-8 34 °C 17.7 l/s 405 m nevyužívaný 4.2 km Borova Hora – BL-2 29 °C 30.0 l/s 300 m nevyužívaný 5.1 km Sources of geothermal and mineral waters
Source Type Water temperature (°C) Yield (l/s) Count Nearest from water kategória d4 minerálna voda 39-55 31-50 1 2.5 km kategória d2 minerálna voda 39-55 5-15 1 2.7 km kategória a1 minerálna voda < 15 < 5 18 2.7 km kategória Kováčová termálne kúpalisko – – 1 2.8 km kategória c1 minerálna voda 23-38 < 5 4 4.1 km kategória b1 minerálna voda 15-22 < 5 7 5.7 km kategória c5 minerálna voda 23-38 > 50 1 7.0 km kategória Kremnica termálne kúpalisko – – 1 9.4 km Environmental burdens, landfills and anthropogenic sediments
Environmental burdens
Site Activity Substance Classification From the water Zvolen – armádne objekty SK1000700P 3.0 km Waste landfills
Landfill Area Year established Monitoring From the water Kašova Lehôtka – Tŕnie 300 m² 1980 – 510 m Pri ihrisku – Tŕnie 20 m² 1985 – 1.2 km Hlobejka – Železná Breznica 150 m² 1980 – 2.5 km Do stráni – Železná Breznica 400 m² 1970 – 2.6 km Dubičie – Kováčová 2 000 m² 1970 – 2.8 km Landslides and slope deformations
Types of deformations
Degree of activity
Current state
How to read these data
Organizations and location
More watercourses nearby
This page is only partially translated. Untranslated parts are shown in Slovak, the original language of the site. Open the Slovak original
24from 100
1445fishing districts
Map color
Loading map…
lowerhigher
Cations (positive ions)
Anions (negative ions)
ArsenicAsvysoká (horných 5 %)
najvyššie 19,0 μg/lmedián 1,00 μg/l9 vzoriek22 % pod medzou stanovenia
AntimonySbvysoká (horných 5 %)
najvyššie 5,00 μg/lmedián 0,500 μg/l9 vzoriek78 % pod medzou stanovenia
ChromiumCrmierne zvýšená
najvyššie 3,00 μg/lmedián 1,00 μg/l9 vzoriek78 % pod medzou stanovenia
CadmiumCdmierne zvýšená
najvyššie 0,250 μg/lmedián 0,250 μg/l1 vzorka
BariumBabežná hodnota
najvyššie 52,0 μg/lmedián 27,0 μg/l9 vzoriek
SeleniumSenižšie ako polovica Slovenska
najvyššie 0,500 μg/lmedián 0,500 μg/l9 vzoriek100 % pod medzou stanovenia
LeadPbnižšie ako polovica Slovenska
najvyššie 2,50 μg/lmedián 2,50 μg/l1 vzorka100 % pod medzou stanovenia
LithiumLinižšie ako polovica Slovenska
najvyššie 5,00 μg/lmedián 5,00 μg/l9 vzoriek100 % pod medzou stanovenia
CopperCunižšie ako polovica Slovenska
najvyššie 1,00 μg/lmedián 1,00 μg/l1 vzorka100 % pod medzou stanovenia
StrontiumSrnižšie ako polovica Slovenska
najvyššie 60,0 μg/lmedián 60,0 μg/l1 vzorka
Oxid kremičitýSiO2vysoká (horných 5 %)
najvyššie 49.7 mg/lmedián 45.1 mg/l9 vzoriek
CadmiumCdextrémna (horný 1 %)
najvyššie 901 μg/lmedián 0,250 μg/l31 vzoriek74 % pod medzou stanovenia
AluminiumAlextrémna (horný 1 %)
najvyššie 0.420 mg/lmedián 0.0200 mg/l31 vzoriek23 % pod medzou stanovenia
CopperCuextrémna (horný 1 %)
najvyššie 15,2 μg/lmedián 0,700 μg/l31 vzoriek
AntimonySbvysoká (horných 5 %)
najvyššie 2,60 μg/lmedián 0,100 μg/l31 vzoriek68 % pod medzou stanovenia
ArsenicAsvysoká (horných 5 %)
najvyššie 7,80 μg/lmedián 0,500 μg/l31 vzoriek55 % pod medzou stanovenia
ZincZnvysoká (horných 5 %)
najvyššie 1 951 μg/lmedián 5,00 μg/l31 vzoriek32 % pod medzou stanovenia
SeleniumSemierne zvýšená
najvyššie 1,00 μg/lmedián 0,500 μg/l31 vzoriek97 % pod medzou stanovenia
ChromiumCrmierne zvýšená
najvyššie 1,00 μg/lmedián 0,250 μg/l31 vzoriek74 % pod medzou stanovenia
LeadPbmierne zvýšená
najvyššie 1,00 μg/lmedián 0,500 μg/l31 vzoriek94 % pod medzou stanovenia
LithiumLibežná hodnota
najvyššie 14,0 μg/lmedián 2,00 μg/l31 vzoriek48 % pod medzou stanovenia
IronFebežná hodnota
najvyššie 0.00500 mg/lmedián 0.00500 mg/l14 vzoriek100 % pod medzou stanovenia
MercuryHgnižšie ako polovica Slovenska
najvyššie 0,100 μg/lmedián 0,100 μg/l31 vzoriek100 % pod medzou stanovenia