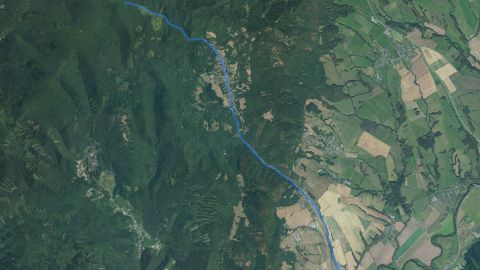
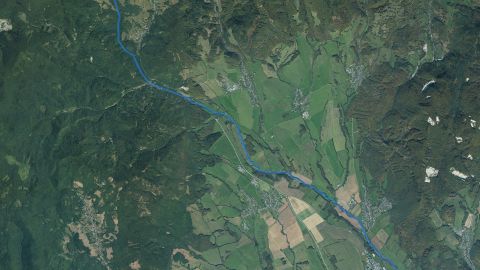
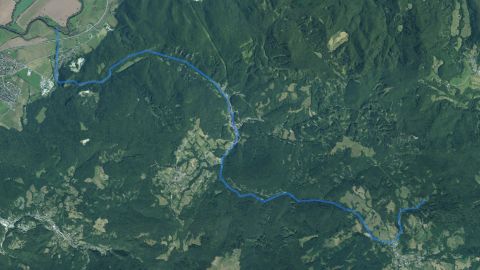
Fishing conditions score, the best window of the day and fishing districts from the best conditions Low activity · average of one fishing district 15:00–17:00 VN Zákruty, window score 19. The score is an estimate of conditions based on weather, water and surroundings, not a bite forecast. Recalculated at 06:04. The course of the watercourse and its fishing districts. You can switch the line color to today's conditions, quality or any other parameter. Detailed filtersregion, district, riverbed, depth, shading, satellites, water chemistry and pollution, fish, geology Move the map with two fingers. In full-screen mode one finger is enough. The score is an estimate of conditions based on weather, water and surroundings, not a bite forecast. For each fishing district you can see what it is made of, how well it is supported by data and where the data comes from. Terrain height along the fishing district and the approximate water level. Reservoir This is a reservoir, so the watercourse is not assessed here: the water has no current, fall or gradient. The chart shows the terrain height along the fishing district. Source: Open Topo Data (eudem25m), 4 Nov 2026. The height is approximate (error of a few metres). Loading the 3D terrain model… Changes in the surroundings and nature from 2018 to 2024: how the banks, vegetation and landscape around the water change. The images switch automatically; you can also browse them by hand. Orthophoto mosaic of Slovakia © GKÚ Bratislava, NLC Zvolen. The year and day of imaging depend on the location, so individual years may differ in season and weather. Water quality according to SHMÚ, wastewater treatment plants near the fishing districts and groundwater nearby 1 of 1 fishing districts on the watercourse with SHMÚ data: the nearest site has an unmet standard in at least one indicator. 1 of 1 fishing district with measurements has groundwater nearby with a value above the limit for at least one indicator. Water pollution in the Hron basinPolluted water in Slovakia Source: SHMÚ (yearbooks on surface and groundwater quality), the register of wastewater treatment plants from VÚVH and the EEA. A SHMÚ site is assigned to a fishing district by the same watercourse name and by distance; the yearbook lists the sites that failed the standard, so a missing site is not proof of clean water. Metals and gold in river sediments and water, old mine workings and deposits, boreholes with archive reports, geothermal energy, environmental burdens and landslides around the stream The overview is based on public registers and atlases of the State Geological Institute of Dionýz Štúr. The search covers a zone around the water of all fishing districts of the stream (1 km of line in total): stream samples within 1 km, boreholes, mine workings and burdens within 3 km, ore occurrences within 5 km, geothermal sources within 10 km. pH 7.8modelled estimate water type Ca–Mg–HCO₃–SO₄ Mineralisation 276 mg/l, moderately hard water (8.8 °dH). Interpolation of measurements from the Geochemical Atlas of Slovakia, not a measurement in the stream. 0 from 15elements in the top 10 % highest: Cobalt 12.2 mg/kg Position of the highest-ranked element among the sample points on streams in Slovakia: percentile 87. Interpolation of the Geochemical Atlas of river sediments. 55°C at 1,000 m depth heat flow 95 mW/m² At a depth of 2,000 m about 95 °C (increase of 40 °C per kilometre). Atlas of Geothermal Energy of Slovakia. 65nGy/h dose rate percentile 94 in Slovakia Natural background from rocks and soil (potassium, uranium, thorium), not a value measured at the water. Airborne gamma-ray spectrometry by ŠGÚDŠ. 0objects within 3 km No old mine working is recorded within 3 km of the water. 1sample with gold 6 ore minerals in the sediment Up to 5 grains in one sample (630 m from the water). Panning prospecting counted gold grains in a concentrate from river sediment. 2 from 10indicators in the top 5 % highest: Arsenic 7.50 μg/l Position of the highest measured value in the distribution of all surface water samples in Slovakia: percentile 95 (600m SZ od K295 Dolná Trnávka). 103boreholes within 3 km 105 water analyses nearby Of these, 103 have an archive report from Geofond. The boreholes are hydrogeological, geological, engineering-geological and other. 54°C at the wellhead 14 geothermal boreholes within 10 km Warmest: Sklené Teplice – ST-4, yield 13.3 l/s, 5.2 km from the water. 5sites within 3 km 5 landfills No environmental burden is registered within 3 km; landfills are only recorded. 9records within 5 km 6 deposits, 3 ore occurrences Geofond registers, the metallogenetic map and the mineral resources map. 43areas within 3 km 4 active Documented landslides in the Geofond register. A landslide into a stream can cloud the water and change the bed. Which rock lies beneath the water line (Geological Map of Slovakia 1:50,000), how old it is, how thick the Quaternary cover is and in which tectonic unit the water flows. The bedrock decides the hardness of the water, the bottom, the turbidity after rain and the abundance of springs. marker on the bar: share among all sample points on streams in Slovakia marker on the bar: share among all sample points on streams in Slovakia marker on the bar: share among all sample points on streams in Slovakia marker on the bar: share among all sample points on streams in Slovakia marker on the bar: share among all sample points on streams in Slovakia marker on the bar: share among all sample points on streams in Slovakia The map covers 0 of 1 points on the water line. Streams and rivers are fed by groundwater. Hydrogeological maps show in which rocks the water is stored, how permeable they are and what the water in them is like. The data come from ŠGÚDŠ maps, not from measurements at a particular water. marker on the bar: share among all sample points on streams in Slovakia marker on the bar: share among all sample points on streams in Slovakia marker on the bar: share among all sample points on streams in Slovakia marker on the bar: share among all sample points on streams in Slovakia Modelled composition of the water in the area the fishing district line runs through. The rasters of the Geochemical Atlas of Slovakia (surface waters) are an interpolation of measurements in sampled streams, so they show the typical background of the area, not a measurement in a particular stream. pH 7.82typical range Most rivers and streams in Slovakia have a pH of 6.5 to 8.5. More acidic water is found in streams on acidic rocks (granites, quartzites), more alkaline water near limestones. 8.8°dH, moderately hard Sum of calcium and magnesium (1.57 mmol/l). Hard water is buffered and its pH changes more slowly; soft water is more sensitive to acid rain. 276mg/l mineralisation Total amount of dissolved minerals. Clean mountain water has tens of mg/l, lowland and limestone waters hundreds. Water type by dominant ions: Ca–Mg–HCO₃–SO₄ Shares are in equivalents, the usual way of comparing the composition of waters. dot: average along the water line, line: from the lowest to the highest value, scale: position among sample points on streams in Slovakia (0 to 100th percentile) The Geochemical Atlas of Slovakia (river sediments) describes what the river carries in the fine material on its bed. Sediment collects metals from rocks, ore occurrences and past mining and industry. It is not a legal limit or a health risk assessment: it shows how an element on this stream ranks among streams in Slovakia. dot: average along the water line, line: from the lowest to the highest value, scale: position among sample points on streams in Slovakia (0 to 100th percentile) Airborne gamma-ray spectrometry by ŠGÚDŠ measures radiation from potassium, uranium and thorium in rocks and soil. Granites and some acidic volcanic rocks have the highest values, limestones and floodplains the lowest. Caesium-137 is a remnant of fallout from the Chernobyl accident and nuclear weapons tests. 65nGy/h in air Natural background from rocks and soil; higher over granites and some acidic volcanic rocks, lower over limestones and floodplains. low Radon is a natural gas from rocks. The risk concerns buildings and cellars, not the water in the stream; it shows what the bedrock is like. dot: average along the water line, line: from the lowest to the highest value, scale: position among sample points on streams in Slovakia (0 to 100th percentile) marker on the bar: share among all sample points on streams in Slovakia Maps of the magnetic field and gravity (ŠGÚDŠ) reveal what lies beneath the sediments and the surface: volcanic bodies, faults and crustal thickness. For an angler they are interesting indirectly: they show where the bedrock changes, and with it the water. -21nT range -21 to -21 nT Deviation of the Earth's magnetic field from its surroundings. Positive and negative anomalies reveal rocks with magnetite (basalts, basic volcanic rocks) and boundaries in the bedrock. -41mGal residual −19.1 mGal Negative values lie over thick sediments and under mountains (light crust), positive over dense rocks and thinner crust. It shows the structure of the Earth's crust, not the water. The Atlas of Geothermal Energy of Slovakia records rock temperature and heat flow from the Earth's interior. It is the potential of the area, not the actual warmth of the water in the stream. Specific geothermal boreholes and springs near this water are in the geothermal energy section below. 55 / 95 °Cat depths of 1,000 and 2,000 m increase of 40 °C per km The line shows the rock temperature; the dotted part is only an extension to the surface. Heat flow 95 mW/m². marker on the bar: share among all sample points on streams in Slovakia A basin is not just water: slope and elevation determine the speed of runoff, climate the temperature and amount of water, and soils what is washed into the stream. The data come from the geomorphological division, climatic-geographical types and soil maps of ŠGÚDŠ. marker on the bar: share among all sample points on streams in Slovakia marker on the bar: share among all sample points on streams in Slovakia marker on the bar: share among all sample points on streams in Slovakia marker on the bar: share among all sample points on streams in Slovakia marker on the bar: share among all sample points on streams in Slovakia marker on the bar: share among all sample points on streams in Slovakia Where the nearest mine workings, deposits, burdens, geothermal boreholes and gold finds are. Groups can be switched off. The line is the water of the fishing district, the light band is the 3 km zone in which boreholes, mine workings and burdens were searched for. The map shows the nearest objects (at most a few dozen from each register), not all of them. The points correspond to the position in the register; area objects are marked by their centre. Arsenic, antimony, cadmium, lead, copper, zinc and other elements in samples from rivers and streams (Geochemical Atlas of Slovakia, surface waters, 2015). The bar shows where the highest value lies among all samples in Slovakia; the light marker is the median of the samples at this water. Highest value: 600m SZ od K295 Dolná Trnávka1993, 980 m from the water. Comparison: percentile 95 of all samples in Slovakia. Highest value: SV od obce Trnávka, 900 m from the water. Comparison: percentile 95 of all samples in Slovakia. Highest value: 600m SZ od K295 Dolná Trnávka1993, 980 m from the water. Comparison: percentile 85 of all samples in Slovakia. Highest value: SV od obce Trnávka1993, 900 m from the water. Comparison: percentile 79 of all samples in Slovakia. Highest value: SV od obce Trnávka1993, 900 m from the water. Comparison: percentile 68 of all samples in Slovakia. Highest value: 600m SZ od K295 Dolná Trnávka1993, 980 m from the water. Comparison: percentile 62 of all samples in Slovakia. Highest value: SV od obce Trnávka1993, 900 m from the water. Comparison: percentile 60 of all samples in Slovakia. Highest value: SV od obce Trnávka1993, 900 m from the water. Comparison: percentile 46 of all samples in Slovakia. Highest value: SV od obce Trnávka1993, 900 m from the water. Comparison: percentile 43 of all samples in Slovakia. Highest value: SV od obce Trnávka1993, 900 m from the water. Comparison: percentile 37 of all samples in Slovakia. Basic water chemistry: which rocks the minerals in it come from. Highest value: 600m SZ od K295 Dolná Trnávka1993, 980 m from the water. Comparison: percentile 86 of all samples in Slovakia. Regional panning prospecting: the heavy fraction was washed out of river gravel and the mineral grains in it were counted. The map of finds is positive: a sample without gold is not listed in the atlas, so the absence of a find is not proof that there is no gold. Hydrogeochemical objects (analyses of springs and boreholes), the geochemical atlas of groundwater (1996) and radiohydrochemical sampling. Groundwater feeds streams, so its composition also affects the water in the stream. Highest value: studňa1991, 2.6 km from the water. Comparison: percentile 97 of all samples in Slovakia. Highest value: studňa1991, 2.8 km from the water. Comparison: percentile 97 of all samples in Slovakia. Highest value: studňa1991, 2.6 km from the water. Comparison: percentile 92 of all samples in Slovakia. Highest value: studňa1991, 2.8 km from the water. Comparison: percentile 90 of all samples in Slovakia. Highest value: prameň1991, 2.5 km from the water. Comparison: percentile 90 of all samples in Slovakia. Highest value: studňa1991, 2.3 km from the water. Comparison: percentile 88 of all samples in Slovakia. Highest value: studňa1991, 1.4 km from the water. Comparison: percentile 84 of all samples in Slovakia. Highest value: studňa1991, 2.3 km from the water. Comparison: percentile 83 of all samples in Slovakia. Highest value: studňa1991, 2.2 km from the water. Comparison: percentile 80 of all samples in Slovakia. Highest value: studňa1991, 2.2 km from the water. Comparison: percentile 66 of all samples in Slovakia. Highest value: studňa1991, 2.3 km from the water. Comparison: percentile 50 of all samples in Slovakia. Highest value: studňa1991, 1.4 km from the water. Comparison: percentile 46 of all samples in Slovakia. Old mine workings outside mining areas (Geofond register), deposits and mining areas, and the metallogenetic map. Gold, silver and other metals near streams can get into sediments and water. Register of hydrogeological boreholes, other boreholes and geothermal boreholes. Each borehole has a report in the Geofond archive (geological profiles, pumping tests, chemical analyses of the water); the report number is in the table. 103 boreholes in the 3 km zone, of which 5 hydrogeological and 98 other; with an archive report number 103. Geothermal boreholes (wellhead water temperature, yield, chemical type) and sources of geothermal and mineral waters within 10 km. Data on the use and existence of a borehole come from the Geofond register. Recorded environmental burdens (industrial sites, landfills, mining), the register of waste landfills and monitoring of anthropogenic sediments (industrial sludge). It is a list of places, not a measurement of water pollution. Register of documented slope deformations (Geofond). Landslides by a stream can bring fine material into the water, change the bed and dam the channel. Data: © ŠGÚDŠ (https://www.geology.sk), downloaded 8 Nov 2026. Details in the Methodology. Who manages the fishing districts and where they are Hron basin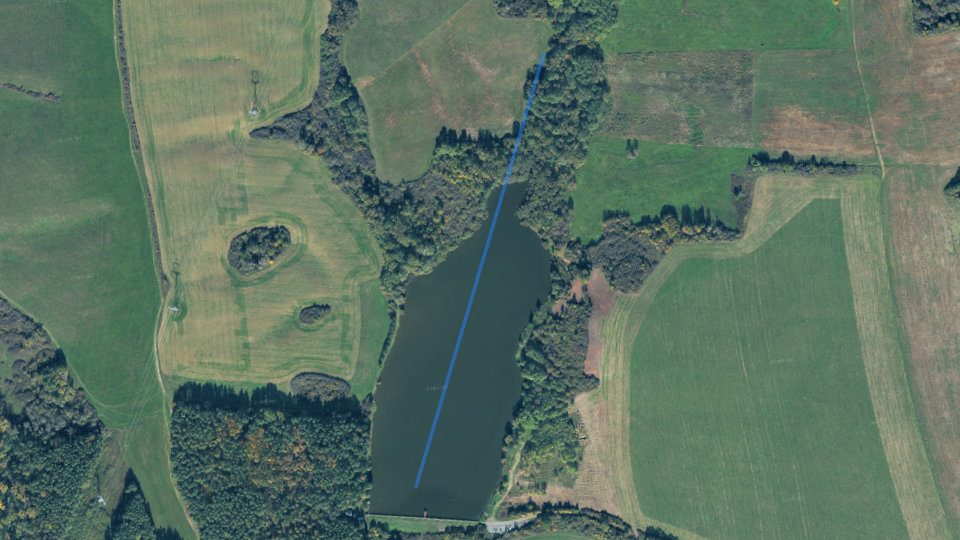
By the water now
Today on the VN Zákruty watercourse
Average of the watercourse's fishing districts
Best window today
Map and fishing districts of the watercourse
Elevation profile: reservoir
Terrain in 3D
Historical images
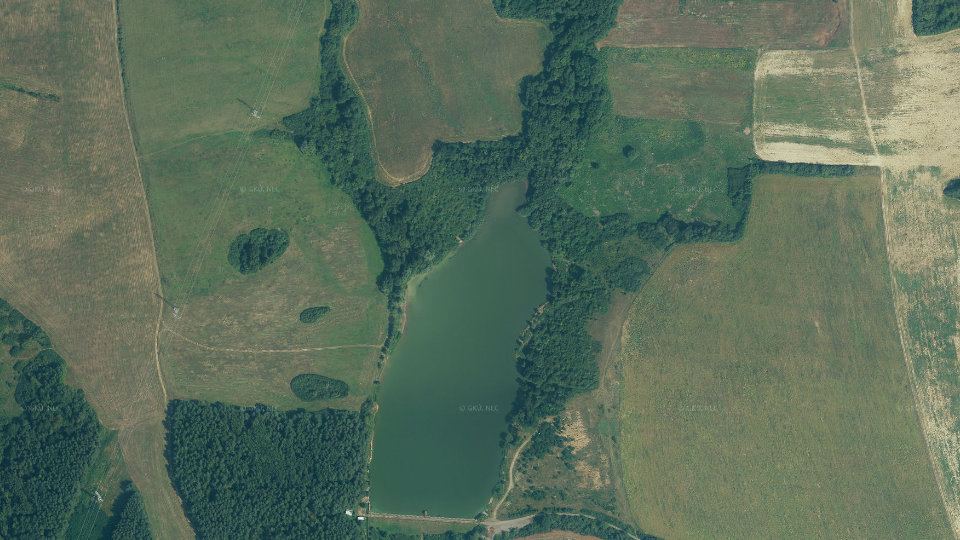
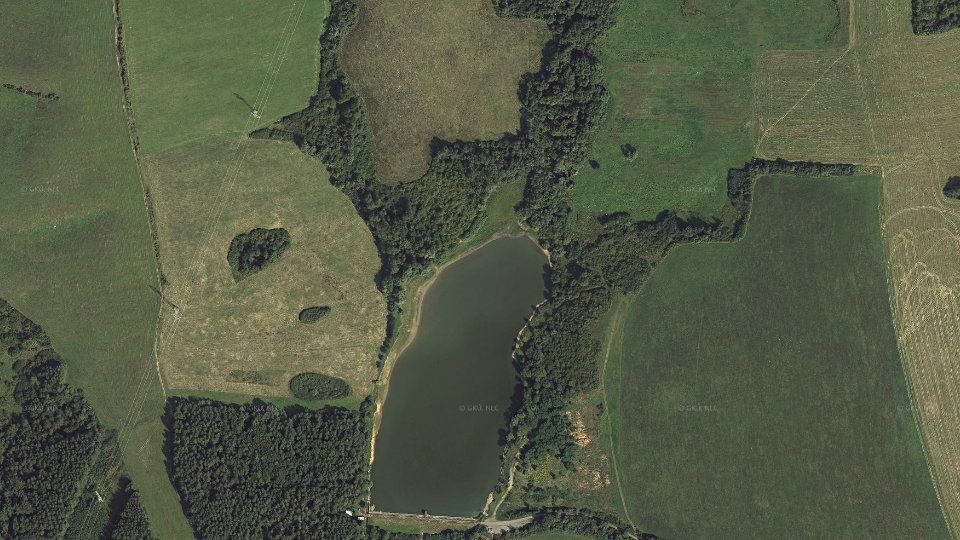
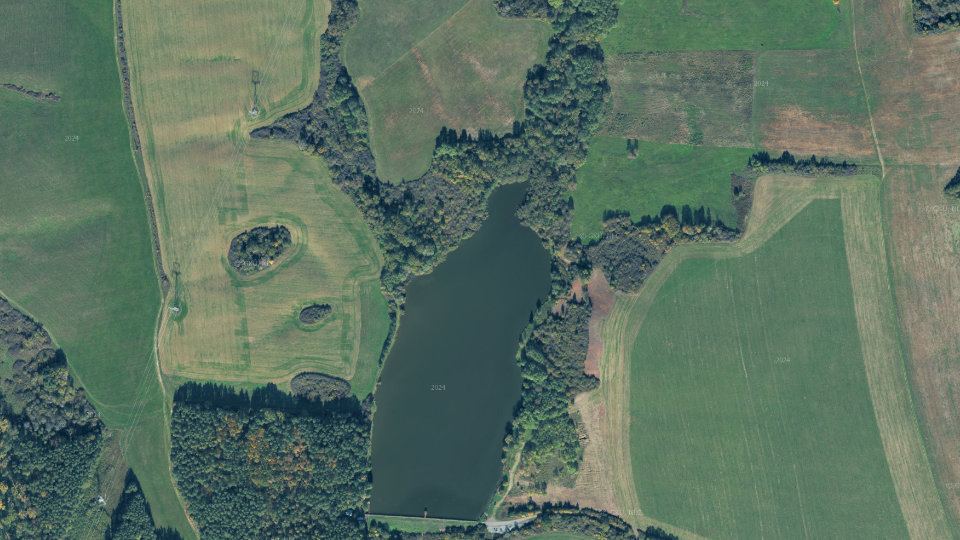
Water pollution on the VN Zákruty watercourse
Surface water near the fishing districtsnearest SHMÚ monitoring site, 2025
Most polluted fishing districtsall with an unmet standard
Groundwater: measured valuestypical value from stations within 10 km, 2025
Geology and geochemistry of the VN Zákruty stream
Water according to the atlas
Elements in river sediment
Heat underfoot
Natural gamma radiation
Old mine workings
Gold in river sediment
Trace elements in the stream water
Boreholes and groundwater analyses
Geothermal energy
Environmental burdens and landfills
Deposits and ore occurrences
Landslides and slope deformations
Geological structure beneath the water
Tectonic division
Regional geological division
Regional geological division (subunits)
Engineering-geological districts
Engineering-geological formations
Susceptibility of the area to slope deformations
Hydrogeology: aquifers and groundwater
Genetic type of groundwater
Chemical type of groundwater
Groundwater quality class
Geothermal groundwater bodies
Surface water chemistry according to the atlas
Water acidity
Water hardness
Dissolved substances
Ionic composition of the water
Major ions
0.202 mg/lpercentile 805.36 mg/lpercentile 7613.4 mg/lpercentile 6045.8 mg/lpercentile 579.38 mg/lpercentile 5112.8 mg/lpercentile 4141.8 mg/lpercentile 29115 mg/lpercentile 22Nutrients and organic pollution
31.1 mg/lpercentile 950.688 mg/lpercentile 884.46 mg/lpercentile 740.0435 mg/lpercentile 22Metals
522 μg/lpercentile 9527.6 μg/lpercentile 92135 μg/lpercentile 850.0809 mg/lpercentile 40Elements in river sediments
Potentially toxic and trace elements
12.2 mg/kgpercentile 8713.0 mg/kgpercentile 8388.4 mg/kgpercentile 811.59 mg/kgpercentile 8018.2 mg/kgpercentile 630.288 mg/kgpercentile 6099.0 mg/kgpercentile 530.393 mg/kgpercentile 530.0953 mg/kgpercentile 4621.6 mg/kgpercentile 402.39 mg/kgpercentile 390.136 mg/kgpercentile 370.178 mg/kgpercentile 3359.1 mg/kgpercentile 2918.1 mg/kgpercentile 22Major elements (iron, aluminium, calcium, magnesium, potassium, sodium, titanium, manganese, phosphorus)
1,784 mg/kgpercentile 935,838 mg/kgpercentile 841,183 mg/kgpercentile 826.30 %percentile 703.13 %percentile 701.63 %percentile 690.835 %percentile 430.596 %percentile 130.754 %percentile 6Further elements (barium, strontium, lithium, rubidium, zirconium, yttrium, cerium, boron, beryllium, gallium)
37.5 mg/kgpercentile 90104 mg/kgpercentile 82507 mg/kgpercentile 8136.4 mg/kgpercentile 8069.6 mg/kgpercentile 791.80 mg/kgpercentile 73510 mg/kgpercentile 7214.4 mg/kgpercentile 5455.8 mg/kgpercentile 36109 mg/kgpercentile 23Natural radioactivity and radon
Gamma radiation dose rate
Radon risk of the bedrock
3.91 ppm95th percentile9.44 ppm90th percentile1.44 %percentile 781,224 Bq/m²percentile 33Radon risk by isopleths
Geophysical fields: magnetics and gravity
Magnetic anomaly
Bouguer gravity anomaly
Geothermal potential
Rock temperature with depth
Geothermal groundwater bodies beneath the water line
Relief, climate and soils
Geomorphological units
Geomorphological regions
Climatic-geographical types
Susceptibility of soils to acidification
Soil contamination (map 1:500,000)
Lithogeochemical types
Map of the corridor
Trace elements in surface waters
Major ions, mineralisation and pH
Gold and ore minerals in river sediments
Nearest samples with gold
Sample Gold in sample From the water 108/G 5 grains 630 m Groundwater: chemistry, water types and radioactivity
Chemical water types nearby
Water quality class according to the hydrogeochemical map
Metals in groundwater
Radon in waters
Type of site Samples Highest radon Median stream, river 1 0,640 Bq/l 0.640 Bq/l well 1 7,13 Bq/l 7.13 Bq/l source 3 56,6 Bq/l 12.5 Bq/l developed spring 1 12,2 Bq/l 12.2 Bq/l Mine workings, deposits and ore occurrences
Deposits and mining areas
Deposit Mineral Status and organisation From the water Lehôtka pod Brehmi perlite Mined deposit – LBK PERLIT, s.r.o. 4.1 km Lehôtka pod Brehmi perlite Mined deposit – LBK PERLIT, s.r.o. 4.1 km Lehôtka pod Brehmi perlite Mined deposit – LBK PERLIT, s.r.o. 4.1 km Lehôtka pod Brehmi – Bralo perlite Deposit with expected use of reserves – ŠGÚDŠ Bratislava 4.4 km Hliník nad Hron building stone Mined deposit – LEVITRADE,s.r.o. 4.9 km Hliník nad Hron building stone Mined deposit – LEVITRADE,s.r.o. 5.0 km Boreholes and Geofond archive reports
Borehole depths
Nearest boreholes
Site Type Depth Archive report From the water Lovča wide-diameter borehole 12.5 m 18976 122Bc35.pdf1.6 km Dolná Trnávka SHMÚ observation borehole 10.3 m 12878 122Bc20.pdf1.9 km Lovča wide-diameter borehole 45.0 m 42946 122Bc48.pdf2.0 km J-111 engineering-geological 8.0 m 589292.0 km JV-21 engineering-geological 6.0 m 857772.1 km J-110 engineering-geological 8.0 m 589292.1 km JV-12 engineering-geological 7.0 m 857772.1 km JV-22 engineering-geological 6.0 m 857772.2 km Horná Trnávka wide-diameter borehole 25.0 m 10393 122Bc7.pdf2.2 km Horná Trnávka wide-diameter borehole 40.5 m 32736 122Bc41.pdf2.2 km JV-23 engineering-geological 7.0 m 857772.4 km ZV-276 engineering-geological 1.0 m 126082.4 km Geothermal energy and mineral waters
Borehole Temperature Yield Depth Chemical water type Use From the water Žiar nad Hronom – RGŽ-2 – – 2500 m – unused 5.1 km Sklené Teplice – ST-4 54 °C 13.3 l/s 1820 m Ca-SO4-HCO3 in use 5.2 km Sklené Teplice – STH-2 45 °C 3.0 l/s 81 m Ca-SO4-HCO3 in use without data reporting 7.4 km Sklené Teplice 46 °C 4.5 l/s 29.7 m Ca-SO4 unused 7.6 km Sklené Teplice 43 °C 0.0 l/s – Ca-SO4 unused 7.7 km Sklené Teplice – ST-2 51 °C 4.5 l/s 107 m Ca-SO4 in use 7.7 km Sklené Teplice 48 °C 0.2 l/s – Ca-SO4 unused 7.7 km Sklené Teplice 49 °C 0.1 l/s 2.5 m Ca-SO4 unused 7.7 km Sklené Teplice – ST-1 52 °C 22.3 l/s 69.7 m Ca-SO4 in use 7.7 km Sklené Teplice 39 °C 0.4 l/s – Ca-SO4 in use 7.8 km Sources of geothermal and mineral waters
Source Type Water temperature (°C) Yield (l/s) Count Nearest from water category a1 mineral water < 15 < 5 6 2.9 km category b1 mineral water 15-22 < 5 1 5.0 km category d1 mineral water 39-55 < 5 4 6.4 km category Sklené Teplice thermal baths – – 1 7.6 km category c1 mineral water 23-38 < 5 3 7.8 km category c2 mineral water 23-38 5-15 1 9.6 km Environmental burdens, landfills and anthropogenic sediments
Waste landfills
Landfill Area Year established Monitoring From the water Lovča 50 m² 1985 – 960 m Dolná Trnávka – 1972 – 1.6 km Dolná Ždaňa 600 m² 1960 – 2.2 km Horná Trnávka – 1990 – 2.7 km Lovča 30 m² 1970 – 2.8 km Landslides and slope deformations
Types of deformations
Degree of activity
Current state
How to read these data
Organizations and location
Organizations on the watercoursewho manages the fishing districts and what the conditions are there today
More watercourses nearby
14from 100
1445fishing districts
Map color
Loading map…
lowerhigher
Cations (positive ions)
Anions (negative ions)
ArsenicAshigh (top 5 %)
highest 7.50 μg/lmedian 4.60 μg/l3 samples
CadmiumCdhigh (top 5 %)
highest 0.800 μg/lmedian 0.600 μg/l3 samples
LithiumLislightly elevated
highest 21.0 μg/lmedian 5.00 μg/l3 samples67 % below the limit of quantification
CopperCuslightly elevated
highest 2.90 μg/lmedian 2.00 μg/l3 samples
ChromiumCrtypical value
highest 1.40 μg/lmedian 1.10 μg/l3 samples33 % below the limit of quantification
StrontiumSrtypical value
highest 240 μg/lmedian 190 μg/l3 samples
BariumBatypical value
highest 50.0 μg/lmedian 40.0 μg/l3 samples
SeleniumSebelow half of Slovakia
highest 0.500 μg/lmedian 0.500 μg/l3 samples100 % below the limit of quantification
LeadPbbelow half of Slovakia
highest 2.50 μg/lmedian 2.50 μg/l3 samples100 % below the limit of quantification
AntimonySbbelow half of Slovakia
highest 0.500 μg/lmedian 0.500 μg/l3 samples100 % below the limit of quantification
Silicon dioxideSiO2slightly elevated
highest 27.8 mg/lmedian 20.2 mg/l3 samples
ArsenicAshigh (top 5 %)
highest 8.40 μg/lmedian 1.70 μg/l7 samples14 % below the limit of quantification
CadmiumCdhigh (top 5 %)
highest 1.00 μg/lmedian 0.250 μg/l7 samples86 % below the limit of quantification
AntimonySbelevated (top 10 %)
highest 0.500 μg/lmedian 0.100 μg/l7 samples86 % below the limit of quantification
ZincZnelevated (top 10 %)
highest 487 μg/lmedian 140 μg/l7 samples
LeadPbelevated (top 10 %)
highest 2.00 μg/lmedian 1.00 μg/l7 samples43 % below the limit of quantification
LithiumLislightly elevated
highest 31.0 μg/lmedian 13.0 μg/l7 samples
SeleniumSeslightly elevated
highest 1.10 μg/lmedian 0.500 μg/l7 samples86 % below the limit of quantification
CopperCuslightly elevated
highest 2.90 μg/lmedian 0.700 μg/l7 samples
AluminiumAlslightly elevated
highest 0.0200 mg/lmedian 0.0100 mg/l7 samples43 % below the limit of quantification
ChromiumCrtypical value
highest 0.500 μg/lmedian 0.250 μg/l7 samples86 % below the limit of quantification
IronFetypical value
highest 0.00500 mg/lmedian 0.00500 mg/l2 samples100 % below the limit of quantification
MercuryHgbelow half of Slovakia
highest 0.100 μg/lmedian 0.100 μg/l7 samples100 % below the limit of quantification