Fishing district boundaries:Čiastkové povodie Čiernej vody od ústia Malého Dunaja pri Starom lese po sútok Stoličného potoka, staré koryto Čiernej vody od ústia Malého Dunaja pod obcou Dolný Chotár po stavidlo pri obci Čierna Voda. Holecov kanál a vodná plocha Feke
Čierna voda č. 1 is carp fishing district no. 2-0320-1-1.It lies in Galanta district (Trnava Region).It belongs to the watercourse Čierna voda.The fishing district is 58.4 km long.The fishing district is managed byMsO SRZ Galanta
Is it worth going today? Conditions score, which species are biting today, the best window of the day, weather, pressure, sun, moon and solunar windowsNajlepšie oknoVoda5,3 °C–
The bite score for fishing district Čierna voda č. 1 is calculated for 7 game fish species from the weather right at the water, water temperature, light and air pressure.The forecast applies to the location 48.030° N, 17.840° E.
Fishing conditionsFish activity indexOur calculation (0–100): the base is set by water temperature, adjusted by light, turbidity, oxygen, weather and other factors according to how well they are supported by studies. For each factor you can see the confidence and the source. A planning aid, not a bite forecast.
The score, the best window of the day and what pushes it up or down
Fishing conditions
Fish activity indexOur calculation (0–100): the base is set by water temperature, adjusted by light, turbidity, oxygen, weather and other factors according to how well they are supported by studies. For each factor you can see the confidence and the source. A planning aid, not a bite forecast.
Loading data…
AirPressure
Weather and forecast for fishing district Čierna voda č. 1
Hour by hour, pressure and the next few days
Weather and forecast
Loading data…
Sunrise6:55Sunset16:11
Sky: sun, moon and solunar windowsSolunar periodsCalculated from the position of the Moon: major periods (about 2 h) around the Moon's passage above and below the horizon, minor periods (about 1 h) around moonrise and moonset. A scientifically unconfirmed theory: in a study of 361 fishing trips (Quigley et al. 2023) it did not predict bites. We treat it as a hypothesis with a weight of at most ±2 points.
Where the sun and moon are right now and when the best windows of the day will come
Sky: sun and moon
Solunar periodsCalculated from the position of the Moon: major periods (about 2 h) around the Moon's passage above and below the horizon, minor periods (about 1 h) around moonrise and moonset. A scientifically unconfirmed theory: in a study of 361 fishing trips (Quigley et al. 2023) it did not predict bites. We treat it as a hypothesis with a weight of at most ±2 points.
Drag along the axis to see where the sun and moon will be.
Sun
Month
Golden hour
Major period
Minor period
Sun
Dawn06:21
Sunrise06:55
Sunset16:11
Dusk16:45
The day lasts 9 h 16 min.
MonthMoon phaseAt full and new moon the gravitational effect is strongest. On a clear full-moon night predators and carp often feed at night, and the day after may be weaker.
First quarter31% illuminated
Moonrise12:12
Moonset21:01
Full moon around 24 Nov, new moon around 9 Dec.
Windows of the daySolunar periodsCalculated from the position of the Moon: major periods (about 2 h) around the Moon's passage above and below the horizon, minor periods (about 1 h) around moonrise and moonset. A scientifically unconfirmed theory: in a study of 361 fishing trips (Quigley et al. 2023) it did not predict bites. We treat it as a hypothesis with a weight of at most ±2 points.
Major solunar period03:09–05:09
Golden hour (morning)06:25–07:55
Minor solunar period11:42–12:42
Golden hour (evening)15:11–16:41
Major solunar period15:33–17:33
Minor solunar period20:31–21:31
Solunar theory is not scientifically confirmed; we treat it as a supplement. The golden hour is the time around sunrise and sunset, when fish often bite.
Rules and permits
Am I allowed to fish here? Closed seasons, fishing hours, size limits, daily limit, permit price, where to buy it, contacts and the managerWater typeCarpOrganizationMsO SRZ Galanta
Fishing district Čierna voda č. 1 is classed as carp waters.Permits for fishing district Čierna voda č. 1 are issued byMsO SRZ Galanta
Water typeKaprový
Law and fishing rules at fishing district Čierna voda č. 1
Closed season, fishing hours, minimum sizes and daily limit. For guidance only: check them in the fishing regulations of the fishing district
Closed season for all fish
§ 13, paragraphs 3 and 5 of the Act
15 Mar – 31 May
JanFebMarAprMayJunJulAugSepOctNovDec
today
fishing for all fish prohibitedoutside this period
The ban does not apply 1 May – 31 May during fishing competitions (§ 13, para. 3). It also does not apply to carp waters that are watercourses (but not reservoirs, dead-end, dead and cut-off arms), or to other water bodies (§ 13, para. 5). Check in the fishing regulations of the fishing district which case your fishing district is.
The protection periods by species (below) apply independently of this closed season.
Daily fishing hours
§ 11 of the Decree
Applies only outside the closed season. Outside these hours fishing is prohibited (§ 14(b) of the Act).
06121824 h
January to April, November, December6.00 – 21.00 h
May4.00 – 24.00 h
June to October0.00 – 24.00 h
Months missing from the table fall within the closed season. The hours in November and December on trout and grayling waters relate to the exception for fishing huchen (§ 13, para. 4 of the Act); check in the fishing regulations what may be caught at that time. On border waters the hours in the permit or the fishing regulations apply (§ 11, para. 2 of the Decree). The Act regulates night fishing in two wordings that seem to contradict each other at first sight, so always ask about it in the fishing regulations of the fishing district or the fishing guard.
on a rod at most 2 hooks (bottom fishing, float fishing), artificial lure at most 3 hooks, a hook at most 3 points, fly fishing at most 3 flies
Live or dead baitfish
prohibited 15 Mar – 31 May; otherwise at least 10 cm and above the minimum size
Fishing days of the week
the law specifies no restriction
Ice fishing
prohibited (watercourses, reservoirs, arms)
Other
spinning and fly fishing with a fish imitation prohibited 15 Mar – 31 May; fishing from a boat prohibited on reservoirs 1 Jan – 31 May
This is a summary. For baits, hooks and groundbait also read the fishing regulations of the fishing district, because the user may tighten the conditions.
2pcsGreen groupeel, carp, burbot, zander, pike, tench, barbel, lake brown trout, brown trout, grayling (combined)
4pcsYellow grouprainbow trout, brook trout, common nase, vimba bream; added to the green or blue group (at most 4 fish in total)
5kgOther speciesfor example crucian carp, breams, dace and chub (combined); invasive species are not counted
The blue and green groups cannot be combined. The limit applies per day, also when fishing in several fishing districts, and once it is reached, fishing for that day ends. The species groups follow the SRZ interpretation of January 2026, not the text of the section directly. The fishing district user may set a lower limit in the permit, in which case the stricter one applies.
Protection periods by species§ 10 of the Decree
During this period the species must not be caught, even if the water type otherwise allows fishing at that time. It applies independently of the closed season for all fish.
1 Jan – 15 Mar
burbot
1 Jan – 31 May
grayling, spirlin, northern pike
1 Jan – 15 Jun
wels catfish, zander (pikeperch), Volga pikeperch
1 Jan – 31 Oct
huchen (in border waters 1 Jan – 31 Aug)
15 Mar – 31 May
common carp in carp waters (does not apply 1 – 31 May during competitions, nor on other water bodies); asp, chub, dace, ide, sterlet, Siberian sturgeon, tench, barbel, vimba bream, zope, white-eye bream, common bream, common nase
1 Sep – 15 Apr
brown trout, brown trout (lake form)
1 Sep – 28 Feb
peled
Some species are protected all year round (for example zingel and streber, lampreys, gudgeons, spined loaches, maraena whitefish, Carpathian barbel, sichel) and fishing for them is always prohibited. The full list of species is in the guide The fishing law, rule by rule.
Minimum sizes§ 12 of the Decree
The shortest length from which you may keep a fish. The fishing district user may raise the size, so look for the valid value in the permit and the fishing regulations.
Total length is measured from the front of the head to the end of the longest ray of the tail fin (§ 12, para. 4). No minimum size applies, for example, to bleak, goldfish, European perch, roach, stone loach and invasive species.
Before and after fishing
Carry your fishing license and permit while fishing and show them when checked (§ 12 of the Act). Check that they are valid.
Before you start fishing, write down the date and the fishing district number (no. 2-0320-1-1); after fishing, write down the number and weight of your catch (§ 14(d) of the Act). Fishing without a record is an offense.
Prohibited fishing methods, night fishing, competitions and other rules are covered in the guide The fishing law, rule by rule.
As of 6 Nov 2026: Act no. 216/2018 Coll. on Fisheries (wording effective 1 Jan 2022) and Decree no. 381/2018 Coll. (wording effective 1 Jan 2019); we found no newer wording. The law may change; you can find the current wording on Slov-Lex (Act) and Slov-Lex (Decree).
Who manages fishing district Čierna voda č. 1
The manager, the user and the organization that issues permits
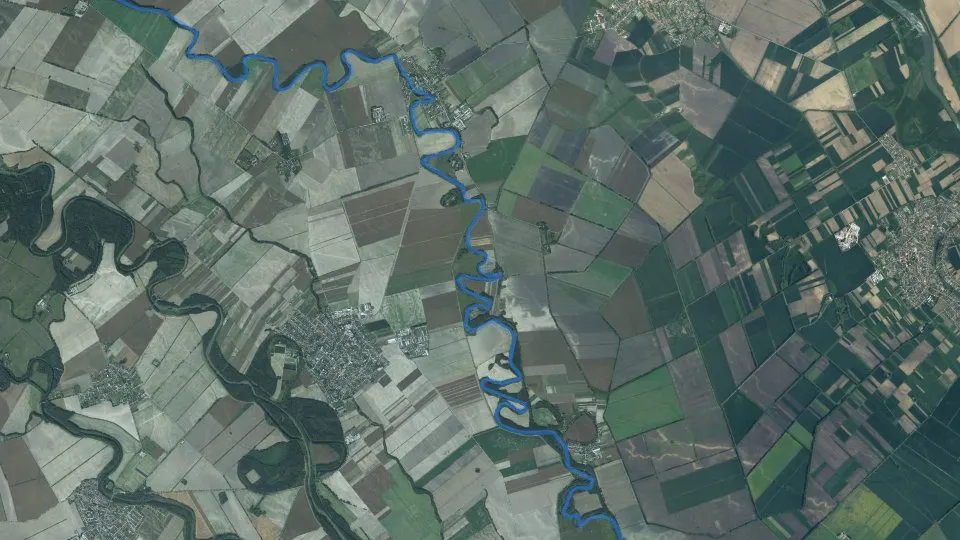
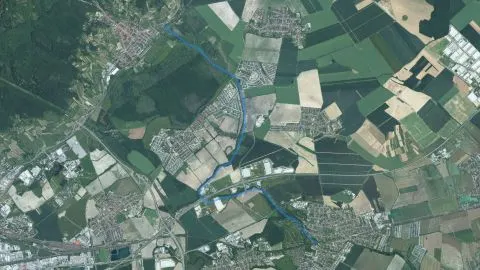
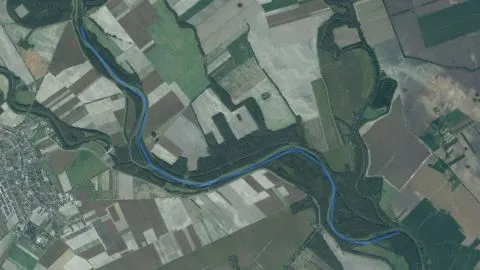
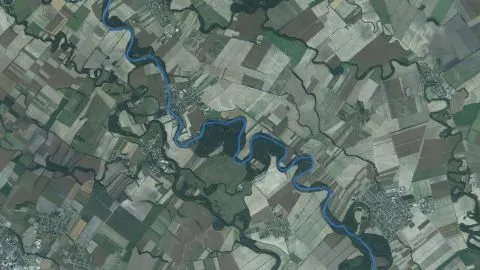
The line shows the course of the fishing district according to the "Rybárske revíry" data 2026. Verify access points and exact boundaries on site.
Spots by the water, tributary mouths and gradient
Where you can reach the water, where tributaries join and where there is danger
Fishing spot finder
Choose a fish species and the 3D model of the reservoir shows where it is most likely to be right now: by depth, bed, water temperature, light, season and time of day. The spots are an estimate from the environment, not the position of fish.
Weirs, dams and obstaclesWeirs, dams and obstacles · weir
1.7 km
Spots within 3 km of the watercourse are shown.
Elevation profile of the watercourse
Elevation profileHow the altitude of the watercourse changes downstream. It is calculated from a digital relief model (tens of meters), not from a water-level measurement, so it is approximate, especially for narrow streams.
Very slow watercourseA lowland, almost stagnant section: calm, often more turbid water; the bottom tends to be muddy and sandy. Typical of carp fishing districts.
Elevation profile of the fishing district downstream: from 118 to 114 m a.s.l. over 45.2 km.Downstream, from the upper end of the fishing district (left) to the lower end
Highest point
117 m a.s.l.
Lowest point
114 m a.s.l.
DropFallThe difference in altitude between the upper and lower end of the fishing district in meters. The greater the fall over a shorter length, the faster the water.
3.1 m
SlopeWatercourse gradientFall per kilometer in per mille (‰, meters per kilometer). Up to 2 ‰ is a slow lowland river, 5 to 10 ‰ a foothill river (grayling, trout), above 10 ‰ a fast stream.
0.1 ‰
SinuositySinuosityThe length of the watercourse divided by the straight-line distance between its ends. 1.0 is a straight watercourse; above 1.3 it meanders strongly. Meanders create pools under the banks and shallows in the reaches between.
1.83
Terrain in 3D
Loading the 3D terrain model…
Accommodation, food and services by the water
Accommodation, restaurants, services, fishing tackle and fish sales near the fishing district. Do you run a business here? Add your listingListing by the waterfrom €4.17 a month
Do you run a business by this water?
Add accommodation, a restaurant, a service, a shop or fish sales. Anglers will see it on the Čierna voda č. 1 page and at other fishing districts nearby, from €4.17 a month.
Do you have your own pond or gravel pit? Add a private fishing district with its own page, fishing spot reservations and permit sales.
River channel in 3D
3D model of the whole river opened at this fishing district: discharge from drought to flood, depths and current, fishing spot finder by species, channel cross-section, bed and bedrockDischarge (estimate)25 m³/sChannel width17 m96
River channel
Model estimate
Loading the 3D channel model…
Channel cross-section
Height is measured from the flood level. Bedrock layer thicknesses are illustrative; the map shows only the surface.
Water area and volume by level
How the flooded area and water volume in the reach change from drought to flood.
Bed and bedrock
Bed by stream slope, bedrock from the geological map.
The river channel is a model: width and slope come from terrain scanning; depths, discharge and flow velocity are estimated from hydraulic relations, not measured by SHMÚ. The flood extent is indicative and does not replace flood hazard maps. Not suitable for boating or wading.
Manning, R. (1891): On the flow of water in open channels and pipes. Transactions of the Institution of Civil Engineers of Ireland 20 (depth and velocity from discharge, slope and channel roughness)
How many different habitats the stream offers: bends, alternating currents, tributary mouths and cover along the bank. A higher number means more places where fish hold, not more fish.
Meanders and bendssinuosity 1.83100
The stream winds: the outer banks of bends tend to be undercut and deep, the inner ones shallow.
Alternating runs and slack watergradient 0.1 ‰100
The gradient changes along the length: runs alternate with calm stretches and pools.
Shade and cover along the bankShady, 41–70 %85
Trees and bushes by the water give shade, roots and fallen trunks under which fish hold.
Bed and bedrock according to maps
What the bed and banks are made of: rock, sediments and their effect on the water
Bed and bedrock
Bottom and bedrock (ŠGÚDŠ)The bedrock under the water according to the hydrogeological map of Slovakia at 1 : 50,000 (ŠGÚDŠ). It tells whether the surroundings are gravelly, sandy, clayey, muddy or rocky.
Clays and loams
After rain the water quickly turns turbid and fish hunt more by smell.
Gravels 25%
Sands 13%
Clays and loams 63%
Springs and outflows
0none within 1 km
According to the geological map: fluviálne sedimenty: nivné povodňové jemnopiesčité hliny, jemno až strednozrnné piesky, holocén | fluviálne sedimenty: litofaciálne nečlenené nivné hliny, alebo piesčité až štrkovité hliny dolinných nív a nív horských po
The fishing district description states the bottom: gravel, sand, fine-grained, muddy; the geological map shows something different, and the fishing district description is more precise.
The map shows the bedrock geology, not the exact bottom at the spot. The actual bottom material may differ, especially where sediment has been deposited.
Fish and catches
Which fish live here, what has been caught here, what is stocked, which species the water suits and what the fish eatDocumented species7Dnes najlepšie
We record 7 game fish species in fishing district Čierna voda č. 1.Of these, 2 species are in the stocking plan.
Fish around the waterFish nearby (GBIF)Fish species that people have recorded around the water (GBIF database, recent decades). It is not a list of species in the fishing district, only a hint of what occurs in the area.
Species that have been observed or recorded near the water. The number next to a fish is the number of records in the GBIF database, not the number of fish.
prefers 9–17 °C, up to 11 cm, average oxygen requirements
Fish: records since 1995 from the surroundings of the water (a rectangle around the fishing district). These are observations and collections, not a list of the fish in the fishing district, so a species may be missing even where it lives.
Invasive species (red label) displace native fish and occupy shallows. Catching and handling them is governed by the fishing regulations; check them before fishing.
Photo credits
Bitterling:Photo: George Chernilevsky, Public domain, Wikimedia Commons
What is stocked into the fishing district and how much
Fish stocking
Minimal stocking
K2 150kg, Šr 500 fish
Which fish this water suits
Suitability of the water for carp, trout and grayling species based on its properties
Water suitability for the fishing district type
Water suitability for the fishing district typeIndex 0 to 100: how well the properties of the water match the needs of trout, grayling or carp, depending on the fishing district type. It is not a bite forecast or a statement about which fish live there.
The most suitable water for carp and cyprinids
The water is in the top 7% of 897 carp fishing districts with data.
Best fit: water acidity (pH)
Reliability medium: we used 5 water data points; the rest are missing and are not part of the assessment.
Stream zoneLevel of evidence: Partially supported
gradient 0.1 ‰, 116 m a.s.l. → lowland zone
Based on gradient and elevation, the stream lies in an area that corresponds to the lowland zone. This is a natural zone for carp and cyprinids.
What we know about it
European streams are divided from source to mouth into zones with typical fish: trout, grayling, barbel and lowland; they are determined mainly by gradient and stream size (Huet 1959), and the zones can also be used to assess the condition of streams (Aarts and Nienhuis 2003). We estimate the zone from the gradient of the fishing district's line and its elevation; it is a simplification without stream width. A match between the zone and the fishing district type adds +1 to quality, a clear mismatch −1.
Sources: Huet 1959; Aarts and Nienhuis 2003
99
Water hardnessLevel of evidence: Hypothesis
≈ 18.4 °dH (3.3 mmol/l of calcium and magnesium), ŠGÚDŠ atlas
Harder water with enough calcium and magnesium is more productive, has a larger food supply and buffers acidity swings better.
What we know about it
Water with calcium and magnesium is more productive and buffers acidity swings better: trout production was higher in calcareous hard waters (Almodóvar et al. 2006), and an index based on dissolved solids and depth predicts fish yield from lakes (Ryder et al. 1974). In Irish streams, however, geology did not change trout density (Lehane et al. 2004), and Downing et al. (1990) showed that production is related rather to primary production. Hence only ±1 point. Hardness comes from the ŠGÚDŠ atlas, not from a measurement in the fishing district; it replaces the separately assessed bedrock of the basin.
Sources: Almodóvar et al. 2006; Lehane et al. 2004; Ryder et al. 1974
98
Water acidity (pH)Level of evidence: Partially supported
pH 8.1, ŠGÚDŠ atlas
The pH is within the range in which fish commonly thrive.
What we know about it
Below about pH 6 fish suffer, and trout and grayling are more sensitive than cyprinids (Alabaster and Lloyd 1982); in acidic soft water, aluminum is released from the soil and damages gills (Gensemer and Playle 1999). The pH from the atlas is a model estimate, so the reduction is only −1 or −2, and only where we have no pH measurement (which is assessed by a separate factor).
Sources: Alabaster and Lloyd 1982; Gensemer and Playle 1999
100
MineralizationLevel of evidence: Hypothesis
≈ 570 mg/l, ŠGÚDŠ atlas
High mineralization: rich water, but already stressful for sensitive species.
What we know about it
Dissolved solids (mineralization) are related to the fertility of the water, which is why Ryder used them to estimate fish production in lakes (Ryder 1965, Ryder et al. 1974). Downing et al. (1990) showed, however, that primary production is a better predictor of production. It does not enter the score, only the suitability index.
Sources: Ryder 1965; Ryder et al. 1974; Downing et al. 1990
98
Metals in sedimentLevel of evidence: Partially supported
3 elements among the highest 10% in Slovakia (ŠGÚDŠ atlas 1999)
Metals in sediment can accumulate in benthic animals and fish; high values are often natural in ore areas. In hard water metals are less toxic, because calcium competes for sites on the gills.
What we know about it
The toxicity of metals to fish decreases with water hardness, because calcium competes with the metal for sites on the gills (Pagenkopf 1983). The ŠGÚDŠ atlas gives only the rank among streams, not a concentration comparable with a limit (MacDonald et al. 2000). In hard water we therefore rate metals more leniently, in soft water more strictly.
Sources: Pagenkopf 1983; Gensemer and Playle 1999; MacDonald et al. 2000
75
How this water would suit each type
Trout40
Grayling49
Carp86
The same water data evaluated against the requirements of trout, grayling and carp. The fishing district is registered as a carp fishing district; its type is highlighted.
The index 0 to 100 compares the properties of the water with the requirements of the species (60 is the neutral value, 100 the ideal). The verbal rating comes from comparison with other fishing districts of the same type, because most Slovak waters have good values for their species. The index does not affect whether fish really occur in the fishing district (that is decided by stocking and the manager). Hardness, pH and mineralization from the atlases are historical and model estimates. Only a small part of this feeds into the conditions score and fishing district quality (hardness ±1, atlas acidity −2 to 0, stream zone match ±1 to quality).
Fish food: aquatic insects
What fish eat in this water and how to choose a bait or fly
Aquatic insects
Aquatic insect swarming (iNaturalist)How many observations of mayflies, caddisflies and stoneflies people nearby recorded this month compared with the annual average. For fly anglers it hints at insect hatches.
Few insectsNovember: 0.0× the average month
Jan
Feb
Mar
Apr
May
Jun
Jul
Aug
Sep
Oct
Nov
Dec
Mayflies0Mayflies: dry fly on the surface, especially at dusk.
Caddisflies0Caddisflies: in the evening and at night by the bank; a nymph and a wet fly also work.
Stoneflies0Stoneflies: clean, cold streams, often already at the end of winter and in early spring.
0.0× the average month, 0 of 45 observations in the year, iNaturalist.
The observations are added by people from the surrounding area; they are not measurements at the water. They show when aquatic insects usually appear and are useful mainly for fly fishing.
Water now
Water level and flow, water temperature, ice on the surface, surface area, clarity, bloom and weed growth from satelliteTeplota vody5,3 °CWater levelWater level steadyClarityVery turbid water
Surface area, water clarity, algal bloom and ice at fishing district Čierna voda č. 1 are tracked from Sentinel satellites.The water level for fishing district Čierna voda č. 1 is measured by an SHMÚ station.Water temperature is measured by an SHMÚ station.
Water level, water temperature and flow at fishing district Čierna voda č. 1
SHMÚ measurements, water temperature estimate and modeled flow
Water level
Water levelThe water level at the nearest SHMÚ gauge in centimeters above the gauge zero. It is the water level at the station, not the depth of the water at the fishing district.
Bernolákovo – Čierna voda · level stable, gauge 44 km away
The water level is stable.Water level trendSlightly rising water washes food out of the banks and activates fish, which move into slacks and behind obstacles. Rapid rising brings turbidity and fish do not bite; falling water after a flood often dampens bites. A stable water level is usually pleasant for fishing, and fish keep settled holding places.
Water level at the gauge, last days (cm)Water level trend: from 14 Nov 11:45 to 15 Nov 11:45. Latest -13 cm, lowest -14, highest -11 cm.
The level is measured at an SHMÚ gauge; it is not the depth of the water in the fishing district.
Water temperature
Water temperatureFish are cold-blooded and water temperature governs their digestion. Below 8 °C metabolism slows down, activity peaks at 15–22 °C, above 25 °C oxygen drops.
0815222530°C
Cold water. The fish's metabolism is slowed. Fine baits and a minimum of feed help.
Water temperature, last days (°C)Water temperature trend: from 14 Nov 11:45 to 15 Nov 11:45. Latest 5.3 °C, lowest 4.5, highest 6.4 °C.
Below 8 °C: slowed metabolism
8–15 °C: activity rises
15–22 °C: peak feeding activity
22–25 °C: activity drops
Above 25 °C: little oxygen
Modeled flow
Modeled flowAn estimate of the amount of water in the river (m³/s) from the GloFAS model, not a measurement. The resolution is about 5 km, so on small streams it may show a larger river nearby.
Loading data…
From space: what the Copernicus satellites show
Sentinel-2 (optical) and Sentinel-1 (radar), updated roughly every 6 days
ClarityVery turbid water
ChlorophyllElevated chlorophyll
OvergrowthClear surface
IceNo ice
The watercourse is narrower than a satellite pixel (10 m). The values are therefore taken from a strip around the fishing district line and from pixels where water mixes with the bank, so they are only approximate and may also show the bank. The water surface area is not assessed for a watercourse, and estimates over the water appear in the image only where the watercourse is wider than a satellite pixel.
Water clarity from the satelliteAn estimate of turbidity from the reflection of light off the water surface in the red band of the Sentinel-2 satellite. Clear water reflects little, turbid water a lot. It is a relative aid, not a measurement.
≈ 108 FNUVery turbid water
clear
moderate
turbid
very
Turbidity above 25 FNU is on 93% of the water surface.
Turbidity estimate trend: from 30 Dec 13:00 to 31 Oct 13:00. Latest 108 FNU, lowest 32, highest 139 FNU.
Since 30 Dec 2025: lowest 32 FNU (4 Jan 2026), highest 139 FNU (24 Apr 2026).
An estimate based on the reflectance of the water in the red band. This is a relative aid, not a measurement in NTU.
Sentinel-2, 31 Oct 2026, 70% of the area cloud-free
Blooms and chlorophyll
Blooms and chlorophyllThe NDCI index compares the reflectance in the red edge (705 nm) and in the red band (665 nm). Higher values mean more chlorophyll-a, i.e. more algae and cyanobacteria in the water.
NDCI 0.07Elevated chlorophyll
low
gentle
elevated
high
Elevated chlorophyll shows on 0% of the water surface.
Chlorophyll index (NDCI) trend: from 30 Dec 13:00 to 31 Oct 13:00. Latest 0.07 , lowest 0.05, highest 0.12 .
Since 30 Dec 2025: lowest 0.05 (24 Apr 2026), highest 0.12 (20 Mar 2026).
The NDCI index tracks chlorophyll-a in plant plankton (algae, cyanobacteria). It cannot determine the algae species or toxicity.
Sentinel-2, 31 Oct 2026
Surface overgrowth
Surface overgrowthThe share of the fishing district's area where the satellite sees green vegetation (NDVI index above 0.3): floating and emergent plants and reeds at the bank.
0 % of areaClear surface
clean
partly
markedly
strongly
The share of the area with green vegetation (plants on and just below the surface, reeds at the bank).
Surface overgrowth trend: from 25 Nov 13:00 to 31 Oct 13:00. Latest 0%, lowest 0, highest 1%.
Since 25 Nov 2025: lowest 0% (25 Nov 2025), highest 1% (1 Sep 2026).
A strip of reeds at the banks may also be counted, so values on small areas may appear higher.
Sentinel-2, 31 Oct 2026, 70% of the area cloud-free
Ice on the surface
Ice on the surfaceThe share of the area where the satellite sees ice or snow. It cannot determine the thickness or load-bearing capacity of the ice.
0 % of areaNo ice
no ice
partly
mostly
whole
The share of the area where the satellite sees ice or snow. Over the last 20 days the highest was 0%.
The satellite cannot determine the thickness or load-bearing capacity of the ice. Never go onto the ice based on this figure.
Sentinel-2, 31 Oct 2026, 70% of the area cloud-free
What this means for fishing
What this means for fishingA short analysis based on satellite data and common angling rules. It is an aid, not a bite forecast.
Very turbid water
After rain or snowmelt fish often stop biting. Try inflows and sheltered coves where the water is clearer, or wait until the water settles.
Many algae and plankton
Rich food for small fish, so cyprinids and the predators after them also stay near the surface. There may be less oxygen near the bottom.
The analysis is based on common angling rules and satellite data. It is an aid, not a bite forecast. The fishing regulations, the permit and the situation on site decide.
Data have been stored since 11 Oct 2025 (45 periods of 5 days); the charts show how they develop. Download history (CSV)
Estimates from satellite images with a resolution of 10 to 20 m, not a measurement in the water. They are affected by clouds, shadows, wind and banks. Do not use them to decide about swimming or going onto the ice. Data: Contains modified Copernicus Sentinel data 2026, ESA, Copernicus Data Space Ecosystem; the latest water indicators are computed from the same Sentinel-2 images in the open data on AWS (Registry of Open Data, resolution 20 m). The procedure is described in the Methodology.
Water quality and cleanliness
Oxygen, pH and hardness, nutrients, pollution, wastewater treatment plants, landfills and contaminated sites nearby, groundwaterQuality indexGood quality76
The water quality index of fishing district Čierna voda č. 1 is 76 out of 100.It is based on 3 groups of data from measurements and registers in the area.
76
Water quality index
Good quality
Five pillars from measurements and registers. A pillar without data is not counted in the index, so check the data reliability too.
Oxygenno data–
We have no measurement or register record for this pillar at this fishing district.
Water pollutionHarmful substances in groundwater (SHMÚ): pesticides (above the standard at 1 of 5 stations); solvents and benzene (above the standard at 1 of 5 stations), highest value 50 times the standard68
Metals, pesticides, PFAS and chlorinated solvents above the standard show the burden on the surroundings. The standards are set for drinking water and are stricter than the limits harmful to fish, so the reduction is small; metals can also come from rocks. PAHs are not counted in the score. Data reliability is 100% (8 stations within 10 km, the nearest 0.6 km, data from 2025); the adjustment was applied in full.
Nutrients and bloomChlorophyll: Elevated chlorophyll, NDCI 0.07, satellite 31 Oct75
Rich food for small fish; in summer oxygen may run low near the bottom.
Pollution sources nearbyno data–
We have no measurement or register record for this pillar at this fishing district.
Acidity and hardnessWater hardness: ≈ 18.4 °dH, ŠGÚDŠ atlas100
Harder water is more productive, has more food and buffers acidity swings better.
Oxygen has a weight of 30%, water pollution 25%, nutrients and bloom 20%, sources nearby 15%, acidity and hardness 10%. Detailed measurements are in the cards below.
What water quality means for fish and fishing
Summary: water and oxygen, pollution and life at the water, and how much they shift the conditions score
What follows from this
Public sources in the conditions scoreData on oxygen, nutrients, reservoir depth, watercourse size, bottom, fish species and insect swarming slightly adjust the "Fishing conditions" score. Each adjustment is shown separately in the score breakdown.
Public data about this water lower the activity score.
Biggest boost: Watercourse size +1
Biggest deduction: Invasive species nearby −2
We assessed 17 factors; 6 of them change the score. The adjustments range from −14 to +12 points so that they do not outweigh the weather and water temperature. They are counted in the score, in the ranking and in the filters.
Water and oxygen−1
Water hardnessLevel of evidence: Hypothesis
≈ 18.4 °dH, ŠGÚDŠ atlas
Harder water is more productive, has more food and buffers acidity swings better.
What we know about it
Water with calcium and magnesium is more productive and buffers acidity swings better: trout production was higher in calcareous hard waters (Almodóvar et al. 2006), and an index based on dissolved solids and depth predicts fish yield from lakes (Ryder et al. 1974). In Irish streams, however, geology did not change trout density (Lehane et al. 2004), and Downing et al. (1990) showed that production is related rather to primary production. Hence only ±1 point. Hardness comes from the ŠGÚDŠ atlas, not from a measurement in the fishing district; it replaces the separately assessed bedrock of the basin.
Sources: Almodóvar et al. 2006; Lehane et al. 2004; Ryder et al. 1974
+1
Water temperature for local speciesLevel of evidence: Partially supported
The water temperature is outside what these species prefer, so they are less active.
What we know about it
We compare the temperature requirements of species (FishBase; for salmonids Elliott and Elliott 2010) with the water temperature for species recorded near the water (GBIF). A species recorded nearby does not necessarily live in this very water, so this is only partly supported.
Sources: Elliott and Elliott 2010
−2
Pollution−2
Harmful substances in groundwater (SHMÚ)Level of evidence: Partially supported
pesticides (above the standard at 1 of 5 stations); solvents and benzene (above the standard at 1 of 5 stations), highest value 50 times the standard
Metals, pesticides, PFAS and chlorinated solvents above the standard show the burden on the surroundings. The standards are set for drinking water and are stricter than the limits harmful to fish, so the reduction is small; metals can also come from rocks. PAHs are not counted in the score. Data reliability is 100% (8 stations within 10 km, the nearest 0.6 km, data from 2025); the adjustment was applied in full.
What we know about it
Metals and metalloids, pesticides, PFAS and chlorinated solvents above the standard at stations within 10 km. The standards are drinking-water standards and stricter than the limits harmful to fish, so the reduction is small: one point for one or two groups of substances, two points for three groups or for a value at least five times above the standard. Metals are poisonous to fish, more so in soft water (Pagenkopf 1983), and PFAS accumulate in tissues (Giesy and Kannan 2001); metals can also come from rocks. PAHs are not counted. The adjustment is multiplied by the reliability of the data.
Sources: SHMÚ, groundwater; Pagenkopf 1983; Giesy and Kannan 2001
−2
Watercourse, reservoir and bottom+1
Watercourse sizeLevel of evidence: Angling practice
catchment above the spot 3,313 km², average flow 12.6 m³/s, HydroRIVERS
A large river has a more stable temperature and water level.
What we know about it
Small streams heat up and dry out quickly in heat waves; large rivers are more stable. Angling practice and a physical consideration.
+1
Life by the water−2
Aquatic insect hatchesLevel of evidence: Angling practice
0.0× the average month, 0 of 45 observations in the year, iNaturalist
Aquatic insects are scarce this month; food near the bottom matters more.
What we know about it
Anglers fish "by the insects" (dry and wet fly). A measured relationship between catches and insect hatches is not documented in our sources.
0
Invasive species nearbyLevel of evidence: Angling practice
Invasive species displace native fish and occupy shallows. The score reduction is only small.
What we know about it
Invasive species displace native fish. The score reduction is only small.
−2
Do not change the score
Data for these factors is missing or within the normal range:
Dissolved oxygen
Nutrients in the water
Water acidity (pH)
Water acidity from the atlas
Ammonium ions in water
Surface water (SHMÚ)
Nitrogen in groundwater
Iron in groundwater
Chlorides in groundwater
Wastewater treatment plants
Bottom by geology
The rules are indicative and based on fishing practice and scientific studies; for each factor you can see how well it is supported. Weather, air pressure and water temperature affect the score more than this data does.
Water composition and pollution
Oxygen, nutrients, the nearest monitoring site and wastewater treatment plants
Water pollution
Water pollution (SHMÚ)Water quality indicators that fail the standards at the nearest monitoring site on the same watercourse in the SHMÚ yearbooks for 2022 to 2025.
Surface water, 2022
within the standardno unmet standard at the nearest SHMÚ site
Treatment plants within 2 km
1no unmet requirements
Surface water: nearest monitoring site
Zaústenie Dudváhu, aboveČierna Voda, river km 6.0 · right at the fishing district
no unmet standard
2022202320242025
In the yearbooks for 2022 to 2025 this site has no unmet indicator.
standard not met
no unmet standard
site not in the yearbook
Other sites on the same watercourse
Čierna VodaČierna Voda, river km 4.8 · right at the fishing district2 indicators
SenecČierna Voda, river km 31.9 · right at the fishing districtno unmet standard
The data comes from the SHMÚ yearbooks (surface waters 2022 to 2025). The yearbook lists the sites that failed the standard; a site missing from the yearbook is not considered clean. We determine the distance and the match of the watercourse name ourselves, so the assignment is indicative.
Wastewater treatment plants
Wastewater treatment plants near the fishing districtPlants within 2 km of the fishing district: overload, compliance with EU requirements and discharged load (BOD₅, COD, nitrogen, phosphorus in tonnes per year).
COV Velke Ulany1.6 km from the fishing district · capacity 5,200 PE · mechanical, biological
within the standard
98% of capacity
Treatment plants within 2 km of the fishing district. The treatment plant need not lie upstream of the fishing district; we do not assess the watercourse at the plant. Load is the ratio of the pollution produced to the capacity of the treatment plant (PE = population equivalent).
Water chemistry, sediments and contaminated sites nearby
pH and hardness, trace elements in water and sediment, landfills and contaminated sites, boreholes with analyses (ŠGÚDŠ)
Water according to the atlas
pH 8.1modeled estimate
water type Ca–Mg–HCO₃
Mineralization 570 mg/l, hard water (18.4 °dH). Interpolation of measurements from the Geochemical Atlas of Slovakia, not a measurement in the stream.
Elements in river sediment
3 from 15elements in the top 10%
highest: Selenium 0.790 mg/kg
Position of the highest-ranked element among the sample points on streams in Slovakia: percentile 95. Interpolation of the Geochemical Atlas of river sediments.
up to 50%
50–75
75–90
90–99
above 99
Trace elements in the stream water
7 from 10indicators in the top 5%
highest: Cadmium 60.5 μg/l
Position of the highest measured value in the distribution of all surface water samples in Slovakia: percentile 99 (Čierna Voda).
up to 50%
50–75
75–90
90–99
above 99
Boreholes and groundwater analyses
269boreholes within 3 km
1193 water analyses nearby
Of these, 269 have an archive report from Geofond. The boreholes are hydrogeological, geological, engineering-geological and other.
Environmental burdens and landfills
13sites within 3 km
13 landfills
No environmental burden is registered within 3 km; landfills are only recorded.
The chemistry of water and sediments is a model estimate from interpolated maps of the Geochemical Atlas of Slovakia, not current monitoring or a measurement in the stream. The proximity of a contaminated site or landfill does not mean that substances from it leak into the water. The locations of the objects are on the map in the Geology and geophysics section.
Groundwater
Stations nearby and measured values
Groundwater nearby
Groundwater nearby (SHMÚ)Measured groundwater values from stations within 10 km of the fishing district (nitrates, harmful substances, ammonium, iron, chlorides) and the SHMÚ yearbooks.
Groundwater within 10 km (8 stations)
MostovaGalanta district · borehole or well · 0.6 km from the fishing district
natural substances only
2017 to 2025
Exceeded in 2025:
Manganese
Measured values, year 2025, sampling 1 Oct 2025 (2 samplings, the highest value of the year for each substance)
Nitrates4.7 mg/l
Ammonium0.07 mg/l
Nitrites0.05 mg/l
Iron0.19 mg/l
Chlorides53.9 mg/l
Aluminum55% of the standard
TomasikovoGalanta district · borehole or well · 0.7 km from the fishing district
natural substances only
2017 to 2025
Exceeded in 2025:
Manganese
Total iron
Measured values, year 2025, sampling 1 Oct 2025 (2 samplings, the highest value of the year for each substance)
Nitrates< 1 mg/l
Ammonium0.17 mg/l
Nitrites0.01 mg/l
Iron0.28 mg/l
Chlorides47.1 mg/l
Aluminum75% of the standard
Kralov BrodGalanta district · borehole or well · 1.0 km from the fishing district
natural substances only
2017 to 2025
Exceeded in 2025:
Manganese
Total iron
Measured values, year 2025, sampling 2 Oct 2025 (2 samplings, the highest value of the year for each substance)
Nitrates< 1 mg/l
Ammonium0.45 mg/l
Nitrites0.03 mg/l
Iron1.93 mg/l
Chlorides85.4 mg/l
Aluminum65% of the standard
Show 5 more
JahodnaDunajská Streda district · borehole or well · 3.0 km from the fishing district
substances from human activity
2017 to 2025
Exceeded in 2025:
Manganese
Total iron
Chloroethene (vinyl chloride)
Measured values, year 2025, sampling 27 Oct 2025 (2 samplings, the highest value of the year for each substance)
Nitrates< 1 mg/l
Ammonium0.06 mg/l
Nitrites< 0.01 mg/l
Iron0.22 mg/l
Chlorides56.9 mg/l
Aluminum15% of the standard
chloroethene (vinyl chloride)4,700% of the standard
Okoc – AszodKomárno district · borehole or well · 3.1 km from the fishing district
natural substances only
2017 to 2025
Exceeded in 2025:
Manganese
Total iron
Measured values, year 2025, sampling 14 Oct 2025 (2 samplings, the highest value of the year for each substance)
Nitrates< 1 mg/l
Ammonium0.42 mg/l
Nitrites< 0.01 mg/l
Iron2.15 mg/l
Chlorides15.9 mg/l
Aluminum15% of the standard
hydroxyterbuthylazine40% of the standard
Nove Osady-sedinGalanta district · borehole or well · 3.8 km from the fishing district
substances from human activity
2017 to 2025
Exceeded in 2025:
Manganese
Ratio of NO3 to NO2
Nitrates
Measured values, year 2025, sampling 2 Oct 2025 (2 samplings, the highest value of the year for each substance)
Nitrates87.4 mg/l
Ammonium< 0.01 mg/l
Nitrites0.02 mg/l
Iron0.003 mg/l
Chlorides77.7 mg/l
Aluminum90% of the standard
MCPA (2-methyl-4-chlorophenoxyacetic acid)70% of the standard
Trhove MytoDunajská Streda district · borehole or well · 4.7 km from the fishing district
natural substances only
2017 to 2025
Exceeded in 2025:
Manganese
Measured values, year 2025, sampling 14 Oct 2025 (2 samplings, the highest value of the year for each substance)
Nitrates1.5 mg/l
Ammonium0.09 mg/l
Nitrites0.05 mg/l
Iron0.026 mg/l
Chlorides35.7 mg/l
Aluminum20% of the standard
chlormequat60% of the standard
benzo(a)pyrene80% of the standard
Dvorniky N.o.-kele Mj.Dunajská Streda district · borehole or well · 5.0 km from the fishing district
substances from human activity
2017 to 2025
Exceeded in 2025:
Manganese
Total iron
Total pesticides
Glyphosate
Chlormequat
Measured values, year 2025, sampling 6 Oct 2025 (2 samplings, the highest value of the year for each substance)
Nitrates1.4 mg/l
Ammonium< 0.01 mg/l
Nitrites0.01 mg/l
Iron0.21 mg/l
Chlorides30.7 mg/l
Aluminum15% of the standard
glyphosate5,000% of the standard
substances from human activity
natural substances only
no exceedance recorded
Groundwater reaches streams as base flow, so the connection to the stream at the fishing district is only indirect. Natural substances (iron, manganese, sulfates, conductivity) are not counted in the yearbook-based assessment.
The data comes from the SHMÚ yearbooks (groundwater 2017 to 2025).
Groundwater: measured values
Groundwater nearby (SHMÚ)Measured groundwater values from stations within 10 km of the fishing district (nitrates, harmful substances, ammonium, iron, chlorides) and the SHMÚ yearbooks.
A typical value from 8 groundwater stations within 10 km of the fishing district (nearest 0.6 km), measured in 2025. Closer stations carry more weight. This is groundwater near the fishing district, not a measurement in the watercourse itself. The standard is the limit that SHMÚ gives for the indicator (for drinking water); a value equal to the standard counts as an exceedance, as it does at SHMÚ. The label "somewhere above the standard" means that the typical value is below the standard but at least one station exceeds it; which one is shown on the tile. Fish are more sensitive to some substances than people are.
Ammonium
0.09mg/l
far below the standard
Standard 0.5 mg/l. Range 0.005 to 0.45 mg/l, 8 stations.
Nitrites
0.02mg/l
far below the standard
Standard 0.5 mg/l. Range 0.005 to 0.05 mg/l, 8 stations.
Nitrates
0.5mg/l
above the standard somewhere
Standard 50 mg/l. Range 0.5 to 87.4 mg/l, 8 stations. Above the standard: 1 of 8 (Nove Osady-sedin, 3.8 km from the fishing district).
Oxygen
0.015mg/l
low oxygen
Mark on the dial: 9 mg/l, the guideline for salmonid waters. Range 0 to 0.35 mg/l, 8 stations.
Water temperature
12.2°C
warmer
Range 11.6 to 12.8 °C, 8 stations.
pH
7.2
suitable for fish
Range 7.11 to 7.33, 8 stations.
Water hardness
4.78mmol/l
hard
Range 3.38 to 5.51 mmol/l, 8 stations.
Iron
0.22mg/l
above the standard
Standard 0.2 mg/l. Range 0.003 to 2.15 mg/l, 8 stations. Above the standard: 5 of 8 (highest: Okoc – Aszod, 3.1 km from the fishing district).
Manganese
0.54mg/l
above the standard
Standard 0.05 mg/l. Range 0.29 to 0.82 mg/l, 8 stations. Above the standard: 8 of 8 (highest: Kralov Brod, 1 km from the fishing district).
Chlorides
53.9mg/l
below the standard
Standard 250 mg/l. Range 15.9 to 85.4 mg/l, 8 stations.
Sulfates
159mg/l
close to the standard
Standard 250 mg/l. Range 70.9 to 175 mg/l, 8 stations.
Conductivity
87mS/m
close to the standard
Standard 125 mS/m. Range 62.6 to 110 mS/m, 8 stations.
Metals and metalloids
55% of standard
close to the standard
Highest: Aluminum 0.18 mg/l (90% of the standard, 3.8 km from the fishing district). 8 stations.
Pesticides
40% of standard
above the standard somewhere
Highest: glyphosate 5 µg/l (5,000% of the standard, 5 km from the fishing district). 5 stations. Above the standard: 1 of 5.
PFAS (“forever chemicals”)
0% of standard
not detected
Below the limit of quantification: substances from this group were not detected in the samples. 4 stations.
Solvents and benzene
0% of standard
above the standard somewhere
Highest: chloroethene (vinyl chloride) 23.5 µg/l (4,700% of the standard, 3 km from the fishing district). 5 stations. Above the standard: 1 of 5.
PAHs (combustion, petroleum substances)
0% of standard
below the standard
Highest: benzo(a)pyrene 0.008 µg/l (80% of the standard, 4.7 km from the fishing district). 5 stations.
How it affects fish and the water
Ammonium
Ammonium ions are not very toxic in themselves, but depending on pH and temperature part of them turns into ammonia (NH₃), which damages the gills and stresses fish. The higher the pH and temperature, the more ammonia there is (Emerson et al. 1975). The repealed Directive 2006/44/EC gave a guideline of at most 0.04 mg/l of ammonium for salmonid waters and 0.2 mg/l for cyprinid waters.
Nitrites
Nitrites are toxic to fish: they pass through the gills into the blood and turn hemoglobin into methemoglobin, which does not carry oxygen, so fish "suffocate" even in oxygenated water. Salmonids are the most sensitive; chlorides in the water reduce the toxicity (Lewis and Morris 1986). Directive 2006/44/EC gave a guideline of 0.01 mg/l for salmonid waters.
Nitrates
Nitrates do not harm adult fish immediately, but they feed algae and plants and so contribute to over-fertilization and nighttime oxygen crashes. For sensitive aquatic animals (salmonids, amphibians, some invertebrates) Camargo et al. (2005) recommend keeping nitrates below 2 mg of nitrogen per liter, which is about 9 mg/l of nitrates.
Oxygen
Fish, especially salmonids, need a lot of oxygen. Directive 2006/44/EC gave a guideline of 9 mg/l for salmonid waters (in at least half of the measurements) and never less than 7 mg/l. Groundwater from deeper layers often has less of it; in the stream it is re-oxygenated only after it emerges.
Water temperature
Groundwater has an almost constant temperature throughout the year. Inflow from springs can therefore cool a stream in summer and warm it in winter, and such sections often serve as refuges for cold-water fish (Hayashi and Rosenberry 2002).
pH
Fish tolerate a pH of roughly 6 to 9 (Directive 2006/44/EC). Outside this range the gills are damaged and the toxicity of ammonia and metals changes.
Water hardness
Harder water (more calcium and magnesium) is better for fish: calcium protects the gills and reduces the toxicity of metals such as copper and zinc (Pagenkopf 1983), and keeps the pH stable. Soft water is more sensitive to metals and to acidification.
Iron
Iron is dissolved in groundwater at depth. When the water reaches the air, it oxidizes and precipitates as brown flocs that clog gills, cover gravel with eggs and invertebrates, and destroy shelters (Vuori 1995).
Manganese
Manganese is natural in deeper groundwater. For fish it tends to matter less than iron; the standard applies mainly because of the taste and color of drinking water.
Chlorides
Chlorides come from road salt, fertilizers and waste. The US EPA (1988) set 230 mg/l for long-term protection of aquatic life and 860 mg/l for short-term.
Sulfates
Sulfates are common in groundwater; they come from rocks (for example gypsum), fertilizers and mines. Together with chlorides they raise the mineralization of the water; the standard of 250 mg/l is set for drinking water.
Conductivity
Conductivity shows the total amount of dissolved salts. A higher value in groundwater is often natural (limestone, gypsum), but a sharp increase in a stream points to an inflow of salts from roads, mines or waste.
Metals and metalloids
Copper, zinc, nickel, cadmium and mercury are toxic to fish even at low concentrations, more so in soft water than in hard water (Pagenkopf 1983). The groundwater standard is set for drinking water, not for fish.
Pesticides
Pesticides get into groundwater from fields. The standard of 0.1 µg/l per substance (0.5 µg/l in total) is a drinking-water standard and is very strict; fish are usually harmed only by a much higher concentration. The value mainly shows how heavily the surroundings are burdened by agriculture.
PFAS (“forever chemicals”)
PFAS are “forever chemicals”: they do not break down and accumulate in the tissues of fish and other animals (Giesy and Kannan 2001). The standard of 0.1 µg/l (sum of 20 substances) is set for drinking water.
Solvents and benzene
Chlorinated solvents (for example tetrachloroethene) and benzene come from industry, treatment plants and petrol stations. They are toxic and break down slowly in groundwater.
PAHs (combustion, petroleum substances)
PAHs are formed by combustion and petroleum spills. The standard for benzo(a)pyrene (0.01 µg/l) is very strict for drinking water because it is a carcinogen.
Sources
Camargo, J. A., Alonso, Á., Salamanca, A. (2005): Nitrate toxicity to aquatic animals: a review with new data for freshwater invertebrates. Chemosphere 58, 1255–1267.
Lewis, W. M., Morris, D. P. (1986): Toxicity of nitrite to fish: a review. Transactions of the American Fisheries Society 115, 183–195.
Emerson, K., Russo, R. C., Lund, R. E., Thurston, R. V. (1975): Aqueous ammonia equilibrium calculations: effect of pH and temperature. Journal of the Fisheries Research Board of Canada 32, 2379–2383.
Directive 2006/44/EC on the quality of fresh waters needing protection or improvement in order to support fish life (repealed in 2013; we give its values here only as an expert guideline).
Vuori, K.-M. (1995): Direct and indirect effects of iron on river ecosystems. Annales Zoologici Fennici 32, 317–329.
Pagenkopf, G. K. (1983): Gill surface interaction model for trace-metal toxicity to fishes: role of complexation, pH, and water hardness. Environmental Science & Technology 17, 342–347.
U.S. EPA (1988): Ambient Water Quality Criteria for Chloride. EPA 440/5-88-001.
Hayashi, M., Rosenberry, D. O. (2002): Effects of ground water exchange on the hydrology and ecology of surface water. Ground Water 40, 309–316.
Giesy, J. P., Kannan, K. (2001): Global distribution of perfluorooctane sulfonate in wildlife. Environmental Science & Technology 35, 1339–1342.
About the fishing district and the watercourse
Location and length of the fishing district, character of the watercourse, river basin, the organization's description and historical satellite imagesRegionTrnava Region76
Fishing district Čierna voda č. 1 has the number 2-0320-1-1.The reliability of data about the fishing district is 76 out of 100.
Fishing district number2-0320-1-1
Location, character and river basin of fishing district Čierna voda č. 1
Where the fishing district lies, what type of water it is, what its river basin is and what the organization writes about it
DepthDepthThe greatest depth from the fishing district description. Shallows warm up quickly and are rich in food; deep pools give shelter and a more stable temperature.1.0–6.0 m
BottomBottomThe bottom material determines which fish live here and where they find food. Fish zones can be recognized by the bottom: rocky, gravelly, sandy to muddy.sandy – gravelly, in places muddy
Watercourse lineWatercourse lineThe shape of the watercourse seen from above. In bends there is a deep scour under the outer bank and a shallow bar under the inner one; a winding stream has more shelter and changes in depth.undulating
ShadingShadingThe share of the water surface in shade. Shade lowers summer water temperatures and supplies insects and shelter; a sunny section warms up faster and becomes more overgrown.50%
VegetationVegetationTree and herbaceous vegetation on the banks. Roots and branches create shelter, and leaves and twigs falling in provide food. It also determines where you can cast and where your rig gets snagged.shrubs
Cross-channel structuresCross-channel structuresWeirs, steps and dams hold back water and stop fish from migrating. Below them a deep plunge pool with oxygenated water forms.Small hydropower plant at the confluence of Little Danube no. 4
What this means for anglersexplanation of the bottom, vegetation, watercourse line and other data of this fishing district
Depth: Deeper, 3–6 m
Fish have somewhere to retreat from both heat and cold. On still waters a temperature layer (thermocline) can form in summer.
Bottom: Gravel bottom
Well-oxygenated water and plentiful food (aquatic insect larvae). Typical of the grayling and barbel zones; gravel bars also serve many fish as spawning grounds.
Bottom: Sandy bottom
Shallower sections with fewer shelters. In lowland streams they alternate with muddy ones; fish keep to banks, roots and obstacles.
Bottom: Muddy bottom
Slow lowland waters and carp fishing districts. Mud hides food, but in summer there may be less oxygen near the bottom, and lures sink into it.
Watercourse line: Undulating line
Pronounced bends. Under the outer bank there is usually a deep hole, on the inner side a shallow gravel or sand bar.
Shade: Shady, 41–70%
In summer the water is cooler, with more insects falling in and more shelter. It is often a good place for trout and grayling.
Cross-channel structures: With cross-channel structures
Weirs, drop structures or barrages: a barrier to fish migration; a plunge pool usually forms below the structure. Check the fishing bans near structures.
The explanation is general and based on the fishing district description in the data and on common fishing practice. Actual conditions on site may differ; check them before you fish.
River basin and reservoir
Reservoir depth (HydroLAKES)Average depth, volume and water retention time in the reservoir from the HydroLAKES database (WWF). The depth is estimated by a model from the surrounding terrain, so it is approximate.
Watercourse from the HydroRIVERS databasematched with the fishing district, line deviation about 282 m
Catchment above the spotWatercourse size (HydroRIVERS)The catchment area above the spot, the stream order and the average flow from the HydroRIVERS database (WWF). It determines whether it is a stream, a river or a large river.
3 313 km²large river
Mean discharge
12.6 m³/smodel value
Stream order (Strahler)
4middle course
Channel gradient
0.1 ‰Very slow watercourse
The data come from a global database with a coarser resolution (tens of meters), so they are only approximate for small waters. Depth and volume are model averages.
Historical images
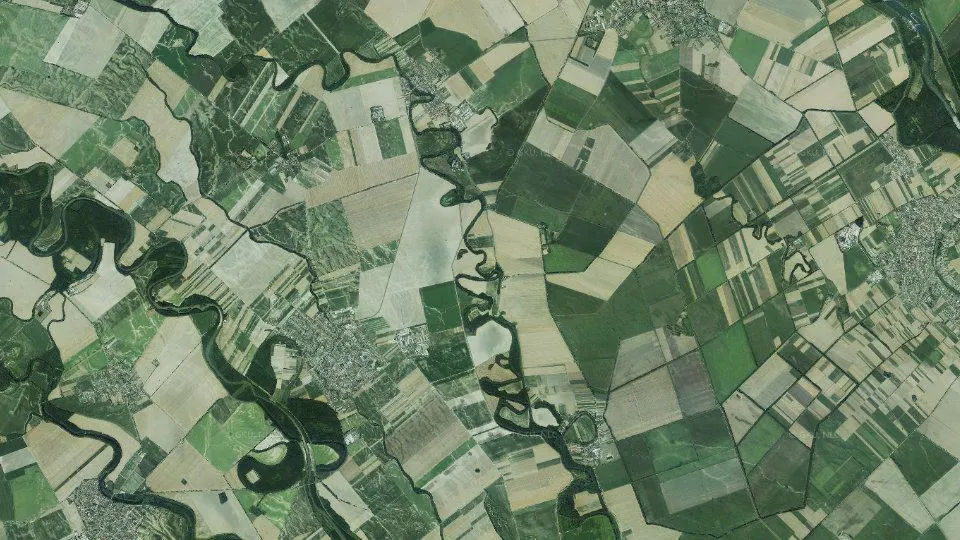
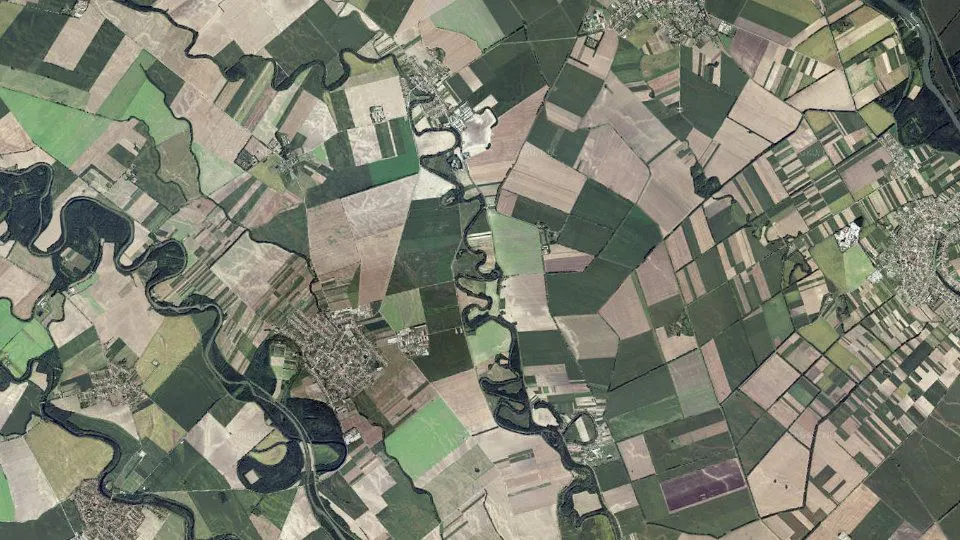
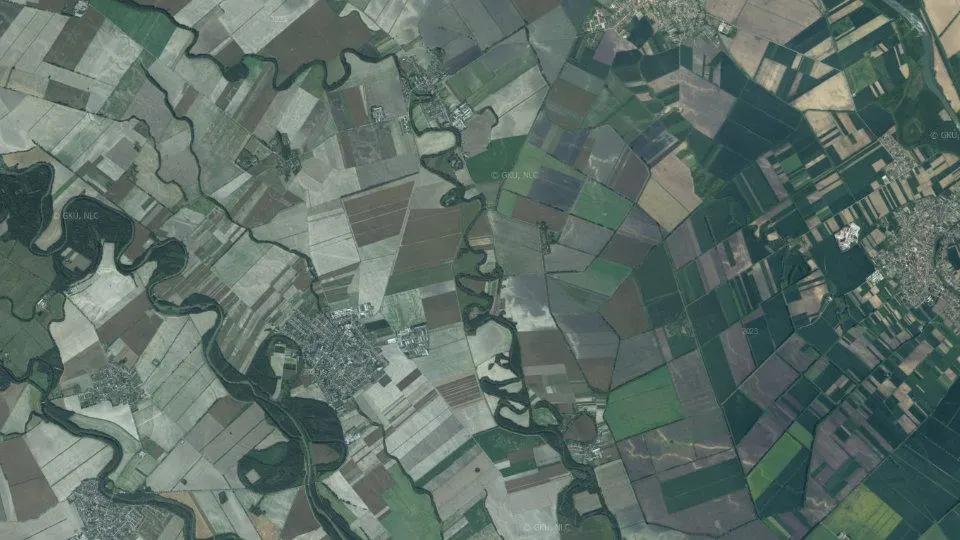
Changes in the surroundings and nature from 2017 to 2023: how the banks, vegetation and landscape around the water change. The images switch automatically; you can also browse them by hand.
2017imaged 1 Aug 20172020imaged 20 Aug 20202023imaged 29 Sep 2023
What is measured right at the water for this fishing district, what is only partly supported, what is a model estimate and what is missing. The higher the number, the more you can rely on the indexes on this page.
measured
Water temperatureIt is measured by an SHMÚ station on this water.
measured
Water stageAn SHMÚ gauging station.
estimate
Weather and pressureA forecast model for the fishing district's coordinates, not a measurement on the bank.
partly
Clarity, bloom and iceSentinel-2 satellite, last usable image 14 days ago.
partly
Water chemistryQuality assessment from the nearest SHMÚ monitoring site.
partly
Fish in the fishing districtThe fishing district's stocking plan and observations at the water. Nobody has recorded a catch here yet.
partly
Rules and permitsThe act, the decree and the list of fishing districts. Check local exceptions in your permit.
estimate
Fishing district locationThe location is approximate, based on the description of the fishing district boundaries.
Geology and geophysics
Rocks under the water, faults and springs, radon and natural radiation, magnetic field, earthquakes, geothermal energy, mines and deposits, landslides
Rocks, faults, radon and geophysical measurements around fishing district Čierna voda č. 1.
Ground under the water: geology, faults and radon
Bedrock, watercourse and springs on the map, values at the location of the water, geomagnetic activity and earthquakes. This is information about the environment; only small hypotheses marked with a confidence level (faults and rocks, geomagnetic storm) enter the score.
The bedrock map needs JavaScript to be turned on.
Geology
Geological map of Slovakia 1 : 50,000: rocks beneath the surface, from alluvial gravels and sands through clays to granites and limestones. Colors follow the ŠGÚDŠ legend; clicking the map shows a description of the rock at that spot.
For anglers: Gravel bars and rocky riffles give a clean bottom and habitat for zander, perch and barbel. Clayey and muddy ground holds food for carp and bream. Limestone and dolomite give harder water that is richer in food than granite and quartzite.
Radon risk
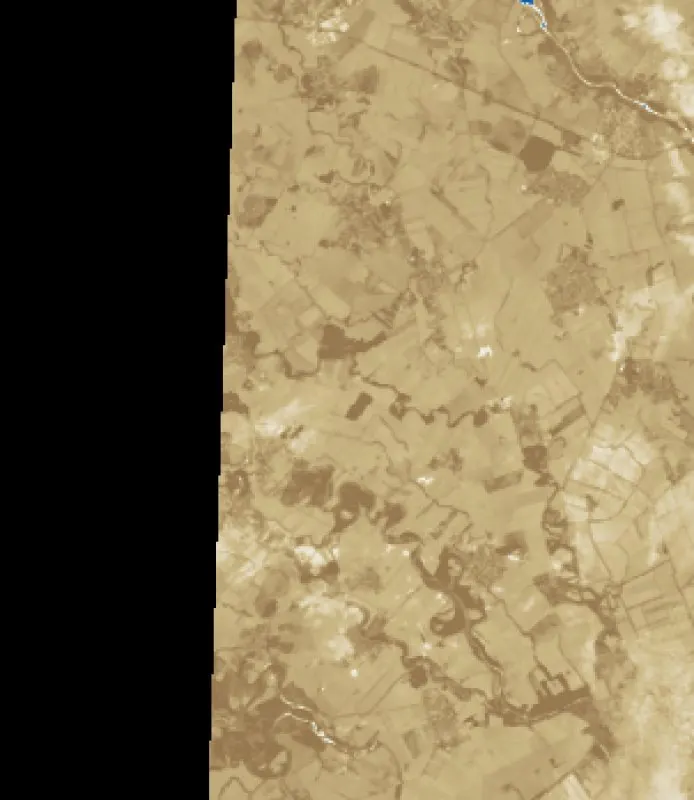
Radon risk of the bedrock (low, medium, high). It is based on the radioactivity of rocks and on fissures. The map shows the bedrock, not radon in water.
For anglers: Radon is a natural tracer of groundwater. Bedrock with a higher radon risk (granite, gneiss, tectonic faults) tends to be where fissure water comes to the surface. Most of Slovakia is "medium", so mainly a high risk is of interest.
low 36.7%
medium 63.0%
high 0.3%
Uranium (eU)
Equivalent uranium in surface rocks from airborne gamma spectrometry (ppm). From 4 ppm the bedrock is usually classified as having an elevated radon risk.
For anglers: A high uranium level is a sign of granite, gneiss and black shales, that is, rocks from which radon and dissolved substances get into the water. It has no direct meaning for bites, but it helps to read the geology of the area.
no data
0 – 1
1 – 2
2 – 3
3 – 4
4 – 5
5 – 7
7 – 35
Gamma radiation
Gamma radiation dose rate in air (nGy/h) from an airborne survey. It is the natural background of the bedrock, not pollution.
For anglers: Higher values are found in rocks rich in uranium, thorium and potassium (granite, gneiss, flysch with shales). It complements the uranium map; for an angler it mainly shows where the bedrock changes.
no data
0 – 20
20 – 40
40 – 60
60 – 80
80 – 100
100 – 140
140 – 180
180 – 220
220 – 999
Magnetics
Anomalies of the Earth's magnetic field (ΔT, in nT) caused by rocks with magnetic minerals, such as volcanic rocks, basalts or amphibolites.
For anglers: Fish (especially salmonids and eels) sense the magnetic field. Whether local anomalies affect their movement and bites has not been shown; it is treated as a hypothesis.
-1 217 – -1 000
-1 000 – -250
-250 – -200
-200 – -190
-190 – -180
-180 – -170
-170 – -160
-160 – -150
-150 – -140
-140 – -130
-130 – -120
-120 – -110
-110 – -100
-100 – -90
-90 – -80
-80 – -60
-60 – -40
-40 – -20
-20 – 0
0 – 10
10 – 20
20 – 30
30 – 40
40 – 50
50 – 70
70 – 100
100 – 150
150 – 200
200 – 250
250 – 300
300 – 400
400 – 500
500 – 600
600 – 700
700 – 800
800 – 900
900 – 1 000
1000 – 1 100
1100 – 1 130
Click or tap the map to find the value at that location.
Values at the water spotBedrock radon risk, uranium, thorium, potassium, gamma radiation and magnetic anomaly at a single spot by the water (marked with a dot on the map).
Radon risk of the bedrock
medium
Common for most of Slovakia.
low
medium
high
Uranium (eU)
2.6ppm
common
Typical background of the rocks.
Thorium (eTh)
7.1ppm
below the crustal average
Natural background of the rocks.
Potassium (K)
1.26%
below the crustal average
Natural background of the rocks.
Gamma radiation
49nGy/h
around the world average
Natural background of the bedrock.
Magnetic anomaly (ΔT)
76nT
above the average of the surroundings
Deviation of the magnetic field from the average of the surroundings.
below averageabove average
The values apply to a single spot (marked with a dot on the map), not as an average of the whole watercourse or river basin. Radon is a natural tracer in groundwater; the map does not include radon in water, only the bedrock risk.
Mark on the dial: the average of the upper continental crust (uranium 2.7 ppm, thorium 10.5 ppm, potassium 2.3%; Rudnick and Gao 2003) and the world average of the natural outdoor dose 59 nGy/h (UNSCEAR 2000). The needle does not swing towards “good” or “bad”; it only shows where the value lies.
Elevated uranium or radon is only information about the rock. It has no proven significance for bites; it helps to read what bedrock the water comes from.
Faults and springs
Faults and springsThe distance to the nearest tectonic fault on the geological map and the number of springs nearby. Fissure groundwater flows out along faults.
Nearest fault
up to 3 km
fault nearby
Tectonic fault on the geological map.
Springs and outflows
0
none marked
None within 1 km.
inferred
Fissure groundwater flows out of the bedrock along faults and at springs. It tends to be cooler in summer and warmer in winter than the water in the stream, so according to anglers' experience fish stay near such places in extreme weather (summer and winter islands of a more suitable temperature).
However, fresh fissure water can have little oxygen. This is anglers' experience, not a phenomenon measured at this fishing district.
Faults are from the geological map at 1 : 50,000. Springs come from a hydrogeological map that covers only some regions, so zero does not mean there are no springs there.
Geology nearby: rock, water, sediments, boreholes
Geology and geochemistry around the waterRock under the water, composition of water and sediments according to the atlases, radioactivity, geothermal potential, boreholes, old mine workings, deposits, burdens, landslides and gold in sediments, from ŠGÚDŠ maps and registers.
The line is the water of the fishing district, the light band is the 3 km zone in which boreholes, mine workings and burdens were searched for. The map shows the nearest objects (at most a few dozen from each register), not all of them. The points correspond to the position in the register; area objects are marked by their center.
Rock under the water
River alluvium88% of the water line
13% young sediments
Gravelly and sandy bottom and floodplains; the water is replenished from groundwater in the alluvium. Geological Map of Slovakia 1:50,000.
Heat underfoot
55°C at 1,000 m depth
heat flow 80 mW/m²
At a depth of 2,000 m about 95 °C (increase of 40 °C per kilometer). Atlas of Geothermal Energy of Slovakia.
Gold in river sediment
0samples with gold
8 ore minerals in the sediment
No gold was found in river sediment samples within 1 km of the water. The samples do not cover every stream, so this does not mean there is no gold here.
Geothermal energy
81°C at the wellhead
11 geothermal boreholes within 10 km
Warmest: Galanta – FGG-2, yield 25.0 l/s, 8.3 km from the water.
Deposits and ore occurrences
11records within 5 km
9 deposits, 2 ore occurrences
Geofond registers, the metallogenetic map and the mineral resources map.
The data come from registers, maps and atlases of the State Geological Institute of Dionýz Štúr and describe the environment around the water. Proximity of a mine working or burden does not mean the water is polluted. The chemistry of water and sediments is a modeled estimate from interpolated maps of the Geochemical Atlas of Slovakia, not current monitoring or a measurement in the stream.
Detailed geology and geochemistry of the whole stream: rock under the water, water composition, elements in sediments, radiation, geothermal potential, metals, gold in sediment, mine workings, boreholes with analyses.
Geomagnetic activity
Geomagnetic activity (Kp)The planetary Kp index (0 to 9) measures the fluctuation of the Earth's magnetic field. From 5 it counts as a geomagnetic storm. The last 48 hours and a forecast for 24 hours are shown.
Kp index
0.7from 9
quiet field
Latest measurement (15 Nov 2026 07:00). The dot on the dial is the highest forecast for the next 24 hours.
48 h agonow+24 h
Highest forecast Kp in the next 24 hours: 3.3 (quiet field).
Kp (0 to 9) measures the fluctuation of the Earth's magnetic field caused by the solar wind. From 5 it counts as a geomagnetic storm. Fish, especially salmonids and eels, sense the magnetic field. That their bites depend on Kp has not been shown, though: these are anglers' observations and hypotheses.
The value is the same for the whole of Slovakia. It enters the activity score only during a strong geomagnetic storm (a hypothesis, −1 to −2 points).
Earthquakes nearby
Earthquakes nearbyTremors recorded within 150 km of the water in the last 30 days (GFZ GEOFON catalog).
Earthquakes nearby
0tremors
no tremors
Within 150 km over the last 30 days (from magnitude 0.0).
According to angling lore, fish (especially catfish and eels) react restlessly to tremors beforehand or stop biting. This is not reliably proven, and with weak tremors it is coincidence. People mostly do not notice deeper tremors from the Carpathians (for example near Komárno and Dobrá Voda) at all.
The GEOFON catalog is global; weak tremors near Slovakia may not all be in it. It is not counted in the activity score.
Wildlife, birds and plants around the water, dangerous and invasive species, what to watch out for
Wildlife, birds and plants observed around fishing district Čierna voda č. 1.
Wildlife, plants and hazards around the waterWildlife and hazards by the water (GBIF)Game animals, birds, plants and hazards (bear, ticks, mosquitoes, giant hogweed) that people have recorded around the water. It is not part of the fishing conditions score and is for information only.
Species that have been observed or recorded around the water. Wildlife, plants and hazards do not enter the fishing conditions score and are for information only. The name of a species leads to its page.
They breed in standing water, so they are worst around reservoirs, oxbow lakes and floodplain forests, especially at sunset.
How to protect yourself: When fishing in the evening and at night wear long sleeves, repellent and a net. Warmth and humidity after rain speed up mosquito development.
Transmits tick-borne encephalitis and Lyme disease. It waits in tall grass and in the vegetation along banks.
How to protect yourself: From spring to autumn check yourself after fishing, use repellent and tuck long trousers into your socks. Remove a tick as soon as possible with tweezers. A vaccination against encephalitis exists.
to be reckoned withinvasive speciesa single record
Most records: Jun.How to protect yourself
An invasive plant that grows along stream banks and on wet meadows. In sunlight its sap causes skin burns.
How to protect yourself: Do not touch it and do not walk through the vegetation. If the sap gets on your skin, wash it off with water and soap and protect the area from the sun. See a doctor for larger burns.
Large biting flies. They are most active on hot, windless days near water and on meadows.
How to protect yourself: They sting painfully, especially in summer around midday. Light-colored clothing with long sleeves and repellent help.
Wildlife, plants and hazards: records come from observations and also reflect where observers move around; they are not density measurements or a guarantee of an encounter. They apply to the surroundings of about 35 × 55 km.
Photo credits
Mallard:Photo: This picture was realized by Richard Bartz by using a Canon EF 70-300mm f/4-5.6 IS USM…, CC BY-SA 2.5, Wikimedia Commons
 Fish
 Fish
 Fish
 Fish
 Fish
 Fish
 Fish
 Fish
 Fish
 Fish
 Invasive species
 Invasive species
 Invasive species
 Invasive species
 Mayflies0Mayflies: dry fly on the surface, especially at dusk.
 Caddisflies0Caddisflies: in the evening and at night by the bank; a nymph and a wet fly also work.
 Stoneflies0Stoneflies: clean, cold streams, often already at the end of winter and in early spring.
 low 36.7%
 medium 63.0%
 high 0.3%
 no data
 0 – 1
 1 – 2
 2 – 3
 3 – 4
 4 – 5
 5 – 7
 7 – 35
 40 – 60
 140 – 180
 180 – 220
 220 – 999
 -1 217 – -1 000
 -1 000 – -250
 -250 – -200
 -200 – -190
 -190 – -180
 -180 – -170
 -170 – -160
 -160 – -150
 -150 – -140
 -140 – -130
 -130 – -120
 -120 – -110
 -110 – -100
 -100 – -90
 -90 – -80
 -80 – -60
 -60 – -40
 -40 – -20
 -20 – 0
 0 – 10
 10 – 20
 20 – 30
 30 – 40
 40 – 50
 50 – 70
 70 – 100
 100 – 150
 150 – 200
 200 – 250
 250 – 300
 300 – 400
 400 – 500
 500 – 600
 600 – 700
 700 – 800
 800 – 900
 900 – 1 000
 1000 – 1 100
 1100 – 1 130
 Bird
 Bird
 Bird
 Bird
 Bird
 Wildlife
 Wildlife
 Wildlife
 Wildlife
 Wildlife
 Wildlife
 Wildlife
 Plant
 Plant
 Plant
 Plant
 Plant
 Invasive plant
 Risk
 Risk
 Risk
 Risk
 2-0330-1-1Carp
 1-0040-1-1Carp
 1-0050-1-1Carp
 2-1950-1-1Carp
 2-1039-1-1Carp
 2-2200-1-1Carp
 2-1200-1-1Carp
 2-1210-1-1Carp
 2-2210-1-1Carp